Weekly Notes from Tim

By Tim Holland, CFA, Chief Investment Officer

  • As a child of the ’70s, I grew up on the reruns of ’50s and ’60s sitcoms – if you were sick and home from school that was what was on TV…My Three Sons, McHale’s Navy, Gilligan’s Island, Denis The Menace, The Beverly Hillbillies. They were all great shows, and Gilligan’s Island and The Beverly Hillbillies led with great theme songs – the former letting us know a three-hour boat tour would lead to years of castaway living and the latter letting us know a poor mountaineer out shooting for some food struck it rich when his errant rifle shot caused the ground to bring forth some bubbling crude…oil, that is, black gold, Texas Tea. And an unconventional approach to oil production is the focus of this week’s note…okay, that is cheesy, but we think it’s worth looking at hydraulic fracturing or fracking.   
     
  • Fracking is a technique used to extract oil and natural gas from deep underground rock formations. While fracking has been around for about 80 years, it was really commercialized about 20 years ago. At a high level, it involves drilling a well and then injecting a high-pressure mix of water, sand and chemicals to create fractures in the rock, which allows the oil and natural gas to flow out and be collected. It’s unlocked billions of barrels of US oil, transformed the global oil industry and, we would argue, meaningfully mitigated the impact geo-political events have on the price of the world’s most important commodity and the US economy.  
     
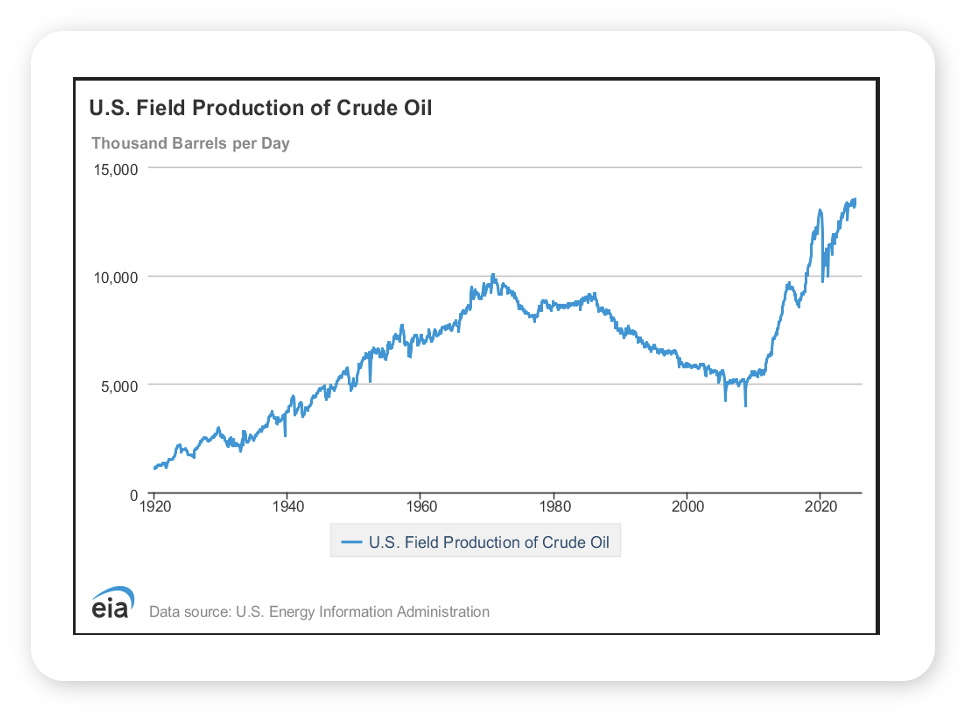
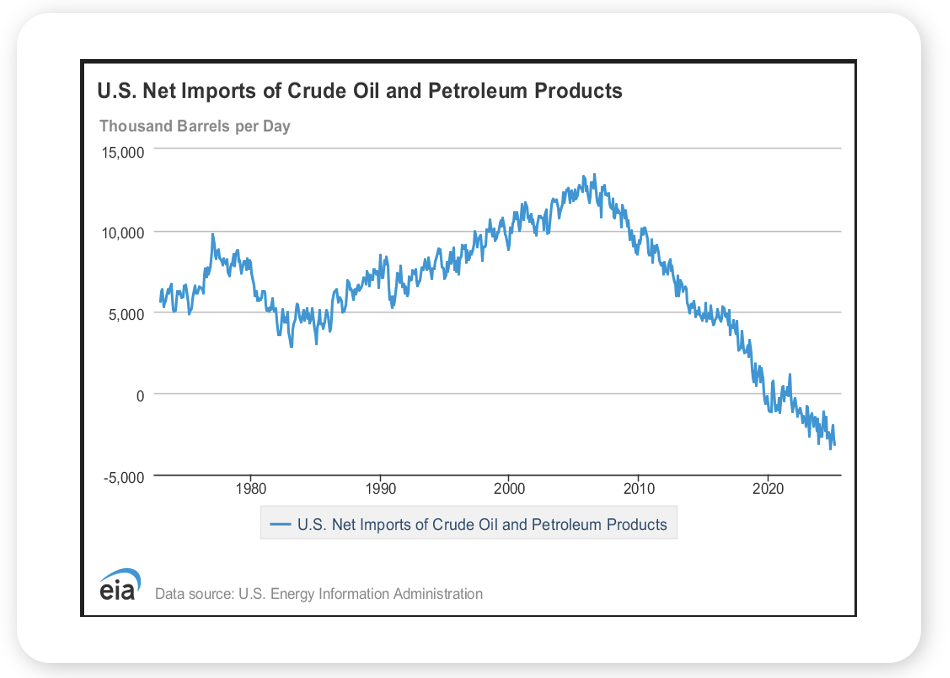
  • Consider the numbers…in 2005, the US was producing about five million barrels of oil a day and importing about 13 million barrels of oil and petroleum products a day….in 2025, the US is producing about 13.5 million barrels of oil a day and exporting about four million barrels of oil and petroleum products a day (see charts). To put a finer point on things, the US has been the world’s top producer of crude oil since 2018 and the world’s top producer of natural gas since 2009.  
     
  • And consider the world we live in…a barrel of West Texas Intermediate Crude Oil, the domestic benchmark, changes hands at $75, below where it traded when Russia invaded Ukraine and Hamas attacked Israel and up just $3 year to date (but below it’s 2025 high of $81). We don’t know where oil would be priced today if fracking had never come along and turned the US into an energy superpower, but we are guessing it would be a lot higher.  
     
Graph 1


Graph 2


Looking Back, Looking Ahead

By Ben Vaske, BFA, Senior Investment Strategist

Last Week

Global equities posted slight losses on the week as markets grappled with multiple news reports. Tensions in the Middle East were less volatile than expected, until the weekend, when the US executed targeted strikes on Iranian nuclear sites. In the US on Wednesday, Jay Powell and The Fed held the Fed Funds rate steady at a target of 425-450. The Fed also projected 50 basis points of cuts still on the table by the end of 2025 - which gave market expectations positive reinforcement - resulting in a moderate rally in risk assets and a reduction in treasury yields. As for performance outside of equities, fixed income indexes rose slightly on falling rates and the broad commodities index gained nearly 2%, bolstered by crude oil prices gaining nearly 4% on the week. The US Dollar rebounded by about 1%, and is now down less than 9% YTD. 
 

This Week

As for this week, we’ll be closely following any news coming out of the Middle East for any signs of further escalation. If escalation continues, expect market volatility and potential increases in oil, gold, and other commodity prices. As for US economic data, we’ll get a release of Consumer Confidence, which was recently rebounded off its low, as well as the Fed’s preferred gauge of inflation, Personal Consumption Expenditures (PCE). We believe the next several inflation reports will be closely watched, as any lagged effects of US tariff policy could begin to rear their head in the hard data.  


We hope you have a great week. If there’s anything we can do to help you, please feel free to reach out to ben.vaske@orion.com or opsresearch@orion.com.
 

Get Your Own Market Commentary

Client-Friendly Weekly Wire

Want a version of Weekly Wire you can send directly to your clients? Subscribe to our Weekly Wire newsletter and get a client-friendly version every Monday. Simply download, add your firm's logo, and use with your clients!


Key Data

Stocks, Bonds, Alternatives, and Real Assets as of June 20, 2025

Security Name

Risk Score

1 Wk

1 Mo

QTD

YTD

1 Yr

3 Yr Ann.

Global Equities (60% US, 40% Intl)

100

-0.41%

0.68%

8.11%

7.08%

12.49%

16.95%

S&P 500 Total Return

102

-0.12%

0.59%

6.68%

2.12%

10.51%

19.35%

Dow Jones Industrial Average

97

0.07%

-0.89%

0.94%

0.06%

9.76%

14.43%

NASDAQ 100 Total Return

122

-0.01%

1.29%

12.38%

3.31%

10.34%

25.33%

TV Benchmark

107

-0.02%

0.33%

6.67%

1.83%

10.20%

19.70%

Morningstar US Large Cap

102

-0.27%

0.97%

7.67%

2.20%

10.82%

21.04%

Morningstar US Mid Cap

113

0.57%

-0.69%

4.93%

2.29%

11.81%

14.05%

Morningstar US Small Cap

125

0.91%

-0.35%

4.49%

-1.86%

8.10%

11.87%

Morningstar US Value

98

0.16%

-0.21%

-1.02%

3.37%

10.13%

13.31%

Morningstar US Growth

126

0.51%

0.98%

13.87%

3.35%

15.86%

20.46%

MSCI ACWI Ex USA

98

-0.97%

0.73%

9.02%

14.86%

14.44%

13.56%

MSCI EAFE

101

-1.45%

-0.30%

8.65%

16.26%

14.12%

15.47%

MSCI EM

98

0.05%

2.34%

9.01%

12.29%

11.87%

9.33%

Bloomberg US Agg Bond Index

27

0.26%

1.08%

0.16%

2.95%

4.32%

2.63%

Bloomberg High Yield Corp Bond Index

41

0.29%

1.00%

2.44%

3.47%

9.20%

9.08%

Bloomberg Commodity Index

70

1.45%

4.84%

1.29%

10.28%

8.77%

-1.04%

Wilshire Liquid Alternative Index

25

-0.03%

0.47%

0.79%

1.55%

2.23%

4.06%

US Dollar

10

1.00%

-1.51%

-5.09%

-8.83%

-6.03%

-1.88%

Bloomberg US Treasury Bill 1-3mo

1

0.08%

0.39%

0.98%

2.03%

4.80%

4.64%

Source: Morningstar

The TV Benchmark represents an average of the S&P 500, Dow Jones IA, and NASDAQ 100 return indexes. The Orion Risk Score represents risk relative to the global equity market.


Interest Rates as of June 20, 2025

Rate

This Week

1 Wk Δ%

13-Wk Treasury Yield

4.20%

-0.04%

10-Yr Treasury Yield

4.38%

-0.04%

Bloomberg US Agg Yield

4.73%

-0.02%

Avg Money Mkt Yield

4.10%

0.00%

Avg 30-Yr Mortgage Rate

6.89%

0.00%

Sources: Yahoo Finance, S&P Global, Crane Data, BankRate


Key Economic Data Last Week

Data Point

Expectation

Actual

U.S. Retail Sales

-0.6%

-0.9%

Housing Starts

1.35M

1.26M

Federal Reserve Interest Rate Decision

Hold

Hold

U.S. Leading Economic Indicators 

-0.1%

-0.1%

Source: MarketWatch,  First Trust


Key Economic Data This Week

Data Point

Expectation

Actual

Consumer Confidence

99.1

6/24/25

New Home Sales

689,000

6/25/25

Q1 GDP (Second Revision)

-0.2%

6/26/25

Personal Consumption Expenditures (PCE) YoY

2.3%

6/27/25

Core (PCE) YoY

2.6%

6/27/25

Source: MarketWatch

 
More Just for You

Want Resources for Your Clients?

Get a version of Weekly Wire you can send directly to your clients. Subscribe to our Weekly Wire newsletter and get a client-friendly version every Monday. Simply download, add your firm's logo, and use with your clients!

The views expressed herein are exclusively those of Orion Portfolio Solutions, LLC d/b/a Brinker Capital Investments, a registered Investment Advisor, and are not meant as investment advice and are subject to change. Information contained herein is derived from sources we believe to be reliable, however, we do not represent that this information is complete or accurate and it should not be relied upon as such. This information is prepared for general information only. It does not have regard to the specific investment objectives, financial situation, and the particular needs of any specific person.

An index is an unmanaged group of assets considered to be representative of a select segment or segments of the market in general, as determined by the index manager for the purposes of managing a specific index. You cannot invest directly in an index.

The CFA® is a globally respected, graduate-level investment credential established in 1962 and awarded by CFA Institute — the largest global association of investment professionals. To learn more about the CFA charter, visit www.cfainstitute.org.

Think2perform’s Behavioral Financial Advice program integrates traditional finance practices with psychology and neuroscience to improve emotional competency and decision-making behavior that increases effective usage of the financial plan with clients. To obtain the Behavioral Financial Advisor (BFA) designation, participants must complete a self-directed course, which takes 20-30 hours to complete, and includes a mix of interactive exercises, videos and case studies. To learn more about the BFA, visit https://www.think2perform.com.

Wealth Management services offered through Orion Portfolio Solutions, LLC d/b/a Brinker Capital Investments a registered investment advisor.