


Many investors may be surprised to hear that U.S. stocks are currently considered “riskier” than non-U.S. stocks. Typically, that isn’t the case or the conventional view. But right now, it’s true. Let’s take a look at why.
First, from a purely statistical standpoint, U.S. stocks are more volatile. They also have a higher correlation to the global market (as defined by the Orion Portfolio Solutions Equity Baseline Portfolio of 60% domestic stocks and 40% non-U.S. stocks). Combine these two investment statistics, and U.S. stocks’ beta is also higher. These are the data points that make up the Orion Portfolio Solutions’ Risk Budgeting score.
The data below confirms these statistics in the 1-year timeframe (yellow columns). The higher the number, the “riskier” the investment is. The U.S. is also more volatile in the 3-year timeframe (green columns), and 5-year timeframe (grey columns), with the exception of emerging markets. Only within the 10-year data do we find the old chestnut to be true, that the U.S. is less risky from a volatility perspective.
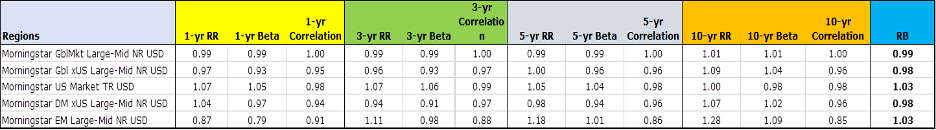
Source: Morningstar Direct, as of August 31, 2020.
How can that be?
One significant reason is that the U.S. has a larger market weight towards volatile growth-oriented technology stocks. As shown in the data below, the U.S. currently has a 27% weight in technology, while the rest of the world’s allocation toward the sector is closer to 10%. Non-U.S. stocks, meanwhile, are heavier in value sectors like financials (17% vs 10%) and natural resources like Energy and Materials (12% vs 5%). Generally speaking, value stocks tend to have lower correlations and thus lower betas, which can create a lower risk profile. (Also interesting is that over the last 3-years, each U.S. sector has had higher stand-alone volatility than its non-U.S. sector counterpart—except for the real estate sector).

Source: Morningstar Direct, as of August 31, 2020.
Older investors say that the statistical measures of risk are hogwash. I understand their arguments, but I would also debate that volatility does in fact create risk by destabilizing an investor’s game plan. Therefore, volatility is indeed risk, even if investors don’t articulate that.
Let’s say, for example, that volatility is actually risk for 90% of investors (I made that up, but I bet I’m close on that percentage if it could be measured). When it comes to the other 10% of investors, many would rely on traditional measures such as dividend yield (the higher the yield, generally speaking, the lower the risk) and valuations (the lower the valuation, generally speaking, the lower the risk).
In the table below, the U.S. Market has a yield of 1.79% versus the Global ex-U.S. yield of 3.50%. That’s a big difference. Even more notable, however, are the relative valuations. The price/book (P/B) and price/sales (P/S) ratios, for instance, are 2x higher in the U.S. than they are in non-US stocks.
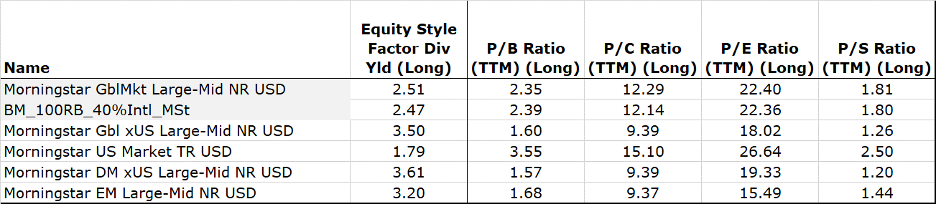
Source: Morningstar Direct, as of August 31, 2020.
Lastly, non-U.S. stocks have stronger balance sheets. In other words, they have less debt. U.S. stocks currently have a debt/capital ratio of 45%. Non-U.S. stocks debt/capital ratio is significantly lower at 33%.
The bottom line is U.S. stocks are currently riskier when measured by either fundamental metrics or by statistical risk measures.
To find out more and to stay on top of all the exciting things going on at Orion, click here.
2349-OPS-09/10/2020
The CFA® is a globally respected, graduate-level investment credential established in 1962 and awarded by CFA Institute — the largest global association of investment professionals. To learn more about the CFA charter, visit www.cfainstitute.org.
The CMT Program demonstrates mastery of a core body of knowledge of investment risk in portfolio management. The Chartered Market Technician® (CMT) designation marks the highest education within the discipline and is the preeminent designation for practitioners of technical analysis worldwide. To learn more about the CMT, visit https://cmtassociation.org/
Correlation is a statistic that measures the degree to which two variables move in relation to each other.
Beta is a measure of the volatility, or systematic risk, of a security or portfolio in comparison to the market as a whole.
The Morningstar DM ex U.S. Large-Mid Index is an index that measures the performance of developed markets ex-U.S. equity markets targeting the top 90% of stocks by market capitalization. An index is an unmanaged group of stocks considered to be representative of different segments of the stock market in general. You cannot invest directly in an index.
The Morningstar EM Large-Mid Index is an index that measures the performance of emerging markets targeting the top 90% of stocks by market capitalization.
Morningstar Global ex U.S. Large-Mid Index is an index that measures the performance of Global Markets (ex-U.S.) equity markets targeting the top 90% of stocks by market capitalization.
The Morningstar Global Market Large-Mid Index is an index that measures the performance of the global market’s equity markets targeting the top 90% of stocks by market capitalization.
The Morningstar U.S. Market Index is an index that measures the performance of U.S. securities and targets 97% market capitalization coverage of the investable universe. It is a diversified broad market index.
OPS Strategies are not sponsored, endorsed, sold or promoted by Morningstar, Inc. or any of its affiliates (all such entities, collectively, “Morningstar Entities”). The Morningstar Entities make no representation or warranty, express or implied, to the owners of the OPS Strategies or any member of the public regarding the advisability of investing in OPS Strategies generally or in the specific strategy presented here in particular or the ability of the OPS Strategies to track general market performance.
THE MORNINGSTAR ENTITIES DO NOT GUARANTEE THE ACCURACY AND/OR THE COMPLETENESS OF THE OPS STRATEGIES OR ANY DATA INCLUDED THEREIN AND MORNINGSTAR ENTITIES SHALL HAVE NO LIABILITY FOR ANY ERRORS, OMISSIONS, OR INTERRUPTIONS THEREIN.