Do Investors Really Want Rate Cuts? · Try Asking Investors These Questions · The Biggest Wave: ETFs
Portfolio Advice, Talking Points, and Useful Resources
- Most investors have been rooting for the Federal Reserve to cut rates. But should they? Rate cuts usually accompany decreased corporate earnings and lower stock prices.
- Many investors, if not most, underestimate the consistently strong performance of the stock market over time — and its volatility.
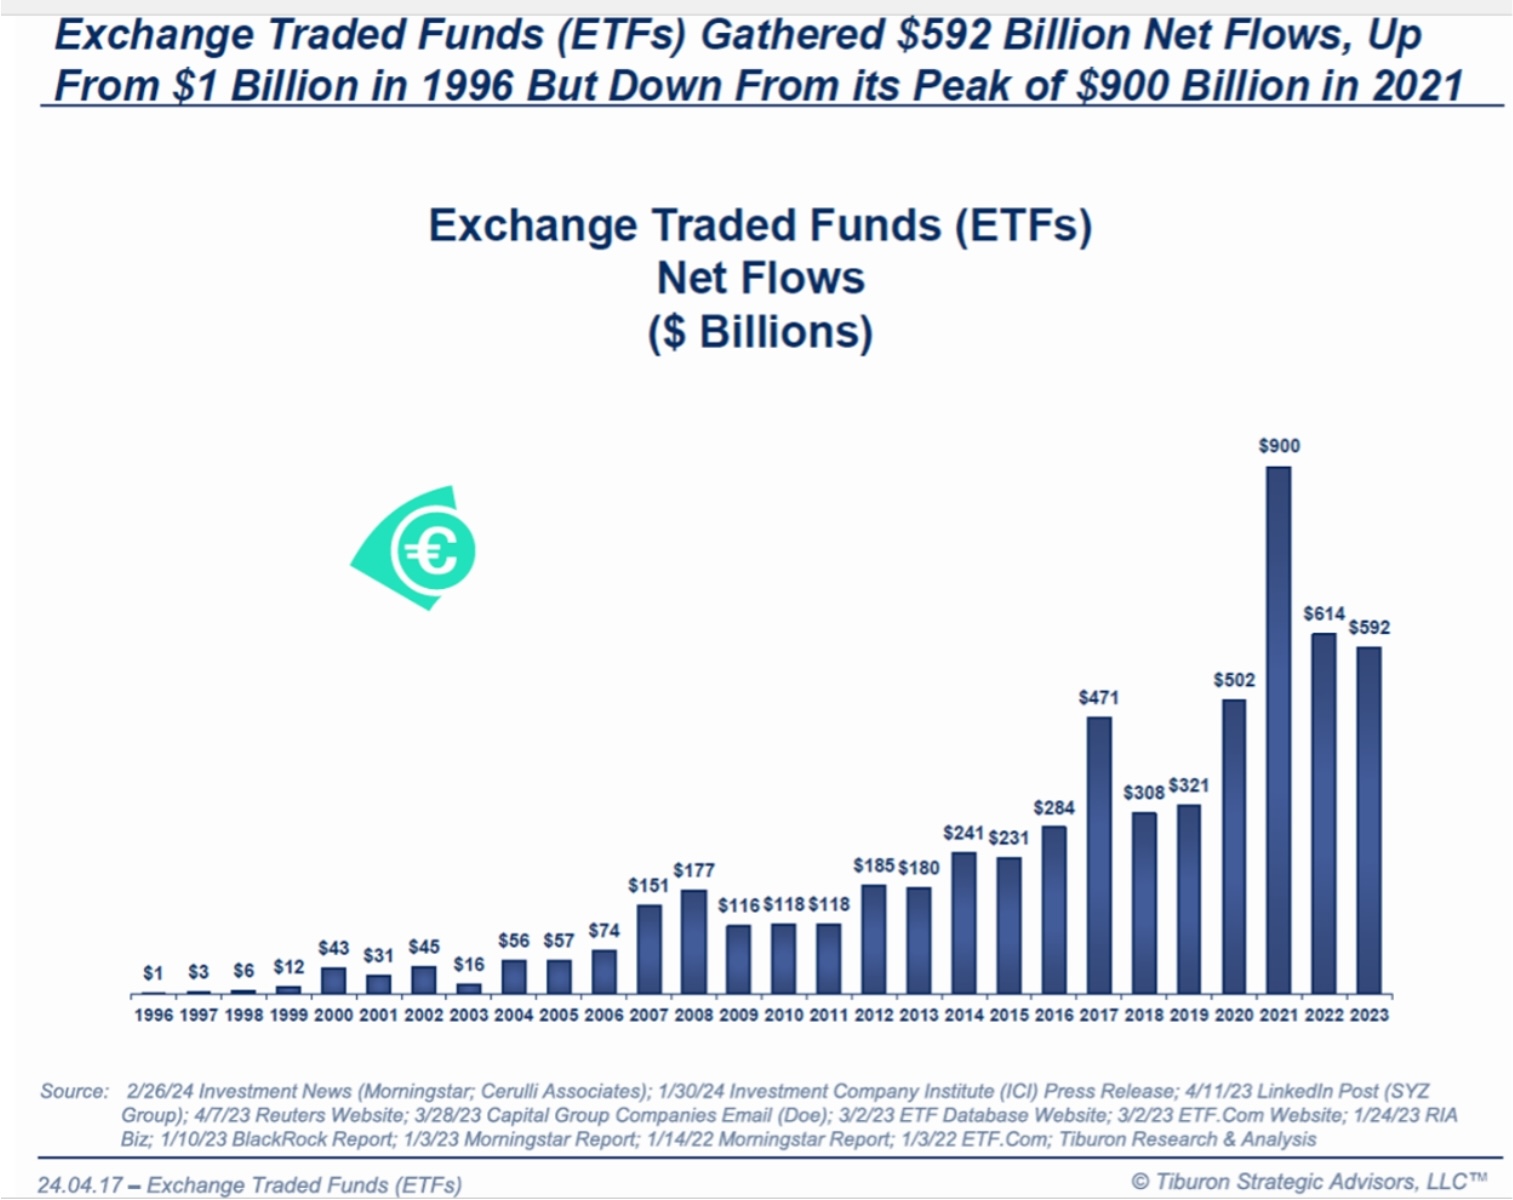
- The growth in exchange-traded funds (ETFs) and investment portfolios comprised of ETFs remains strong.
Heading into the quarter-end, the stock market continues to experience a strong year, and balanced multi-asset portfolios are keeping investors on track toward their investment objectives. However, it is an election year, so many investors are expecting the ride to get bumpier in the back half of the year. While I would argue it is prudent to always expect an uptick in volatility, historically the stock market has performed well in the second half of the presidential election years. Despite the various crosscurrents in both the economic and political environments, the key for long-term investors is to remain invested and diversified.
In this report, we will discuss why investors might not want to root for the Federal Reserve to cut rates. We will also show the historical experience of the U.S. stock market’s strong positive bias. We will end by showing why ETFs and model portfolios of ETFs continue to show strong growth.
Do Investors Really Want Rate Cuts?
Many investors want the Federal Reserve to cut short-term interest rates. Indeed, the stock market has generally gone up this year when investors think the Fed will cut rates soon and down when they believe cuts will be delayed. But should investors really want the Fed to cut rates? Perhaps not, as the stock market typically does not fare well when rates fall.
Let us unpack the chart below from the research firm Strategas’s recent article “Fear the Cut, Not the Pause — For Earnings Too.” It shows what happens to the stock market from when the Fed first cuts interest rates to the following S&P price low. On average, the stock market falls more than 23% over the following six-plus months.
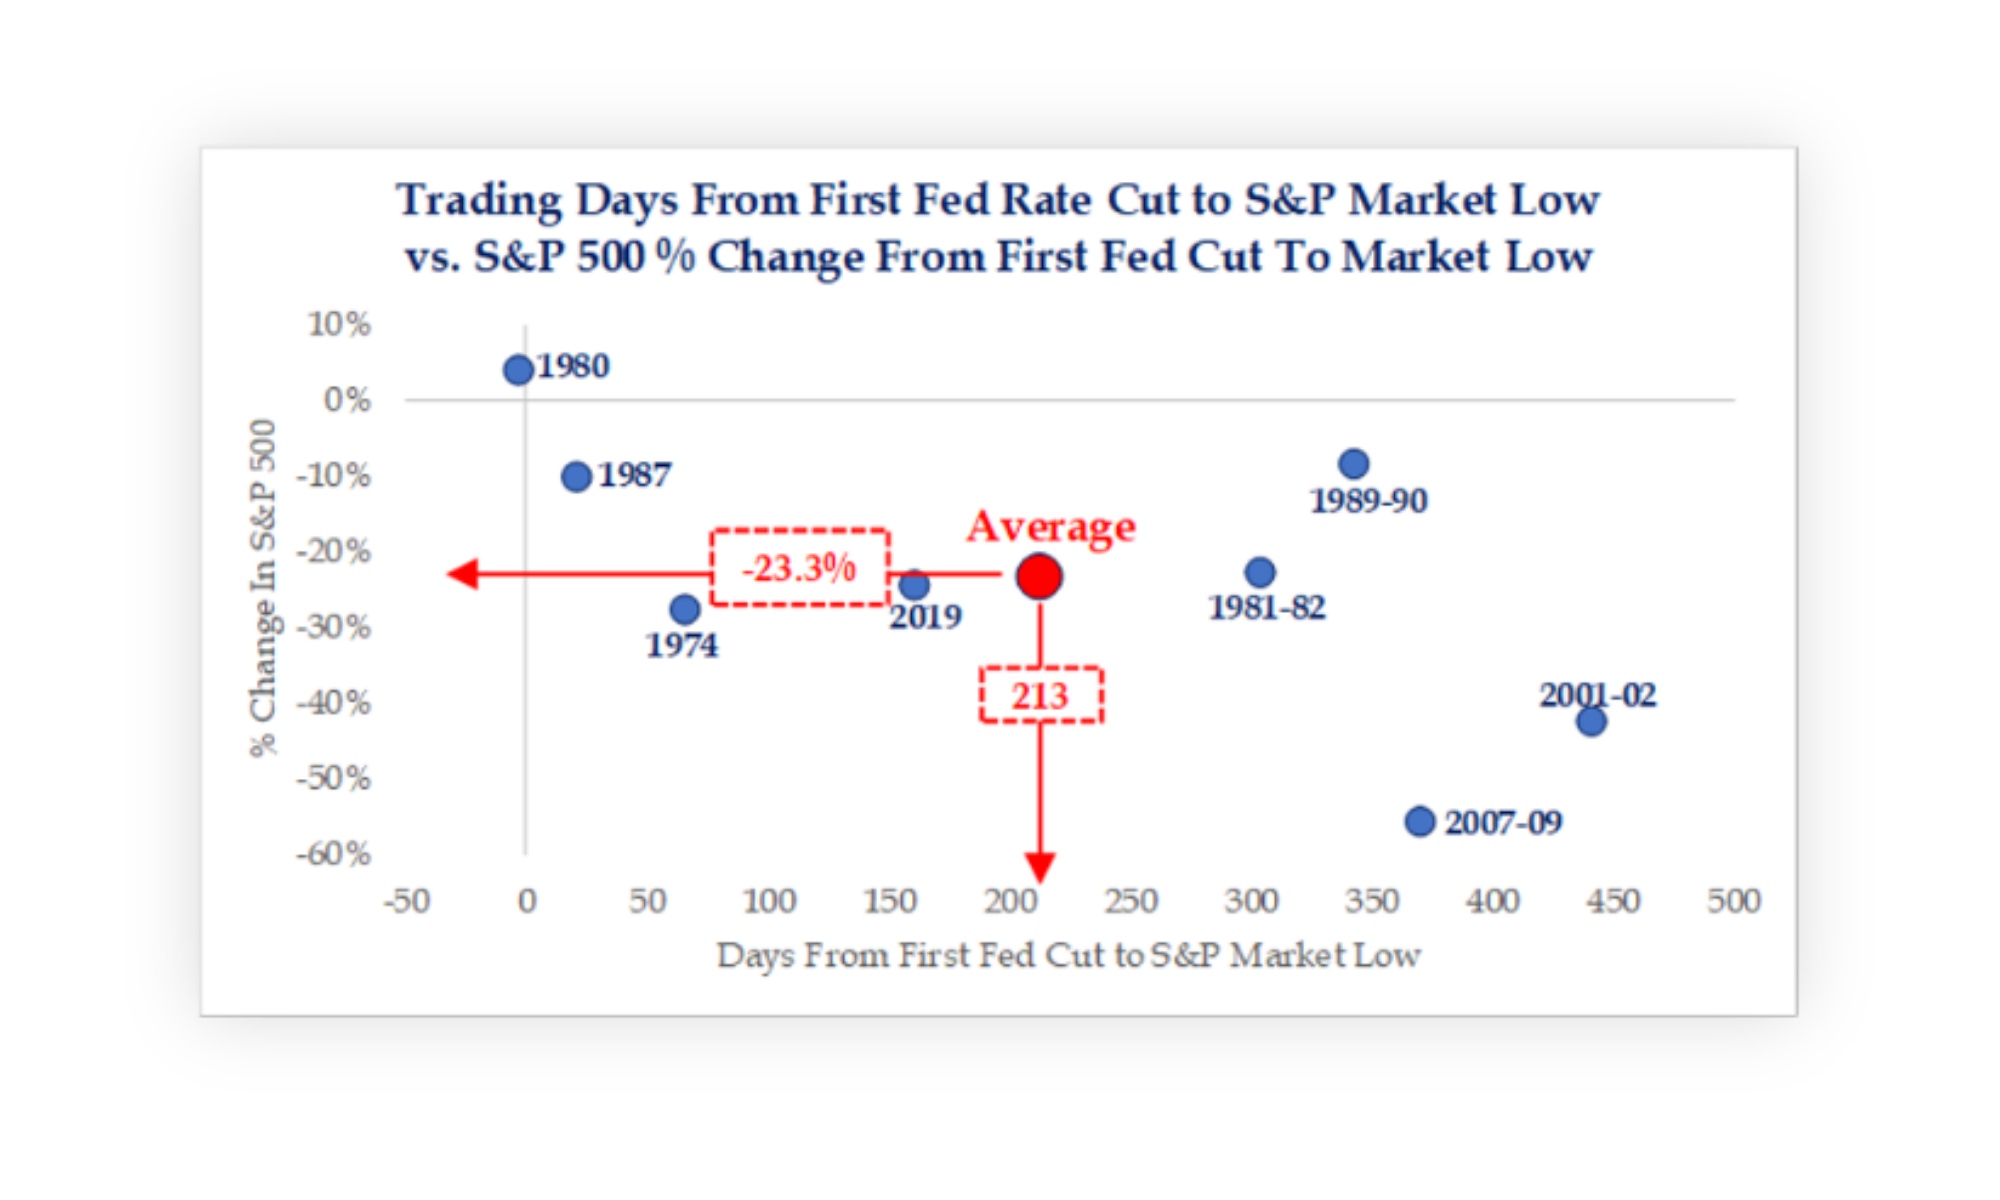
Source: Daily Macro Brief, June 5, 2024, Strategas Securities, LLC.
The next chart, meanwhile, shows what happens to corporate earnings. In this case, the average experience has been a loss of nearly 10% in earnings over the following 12 months.
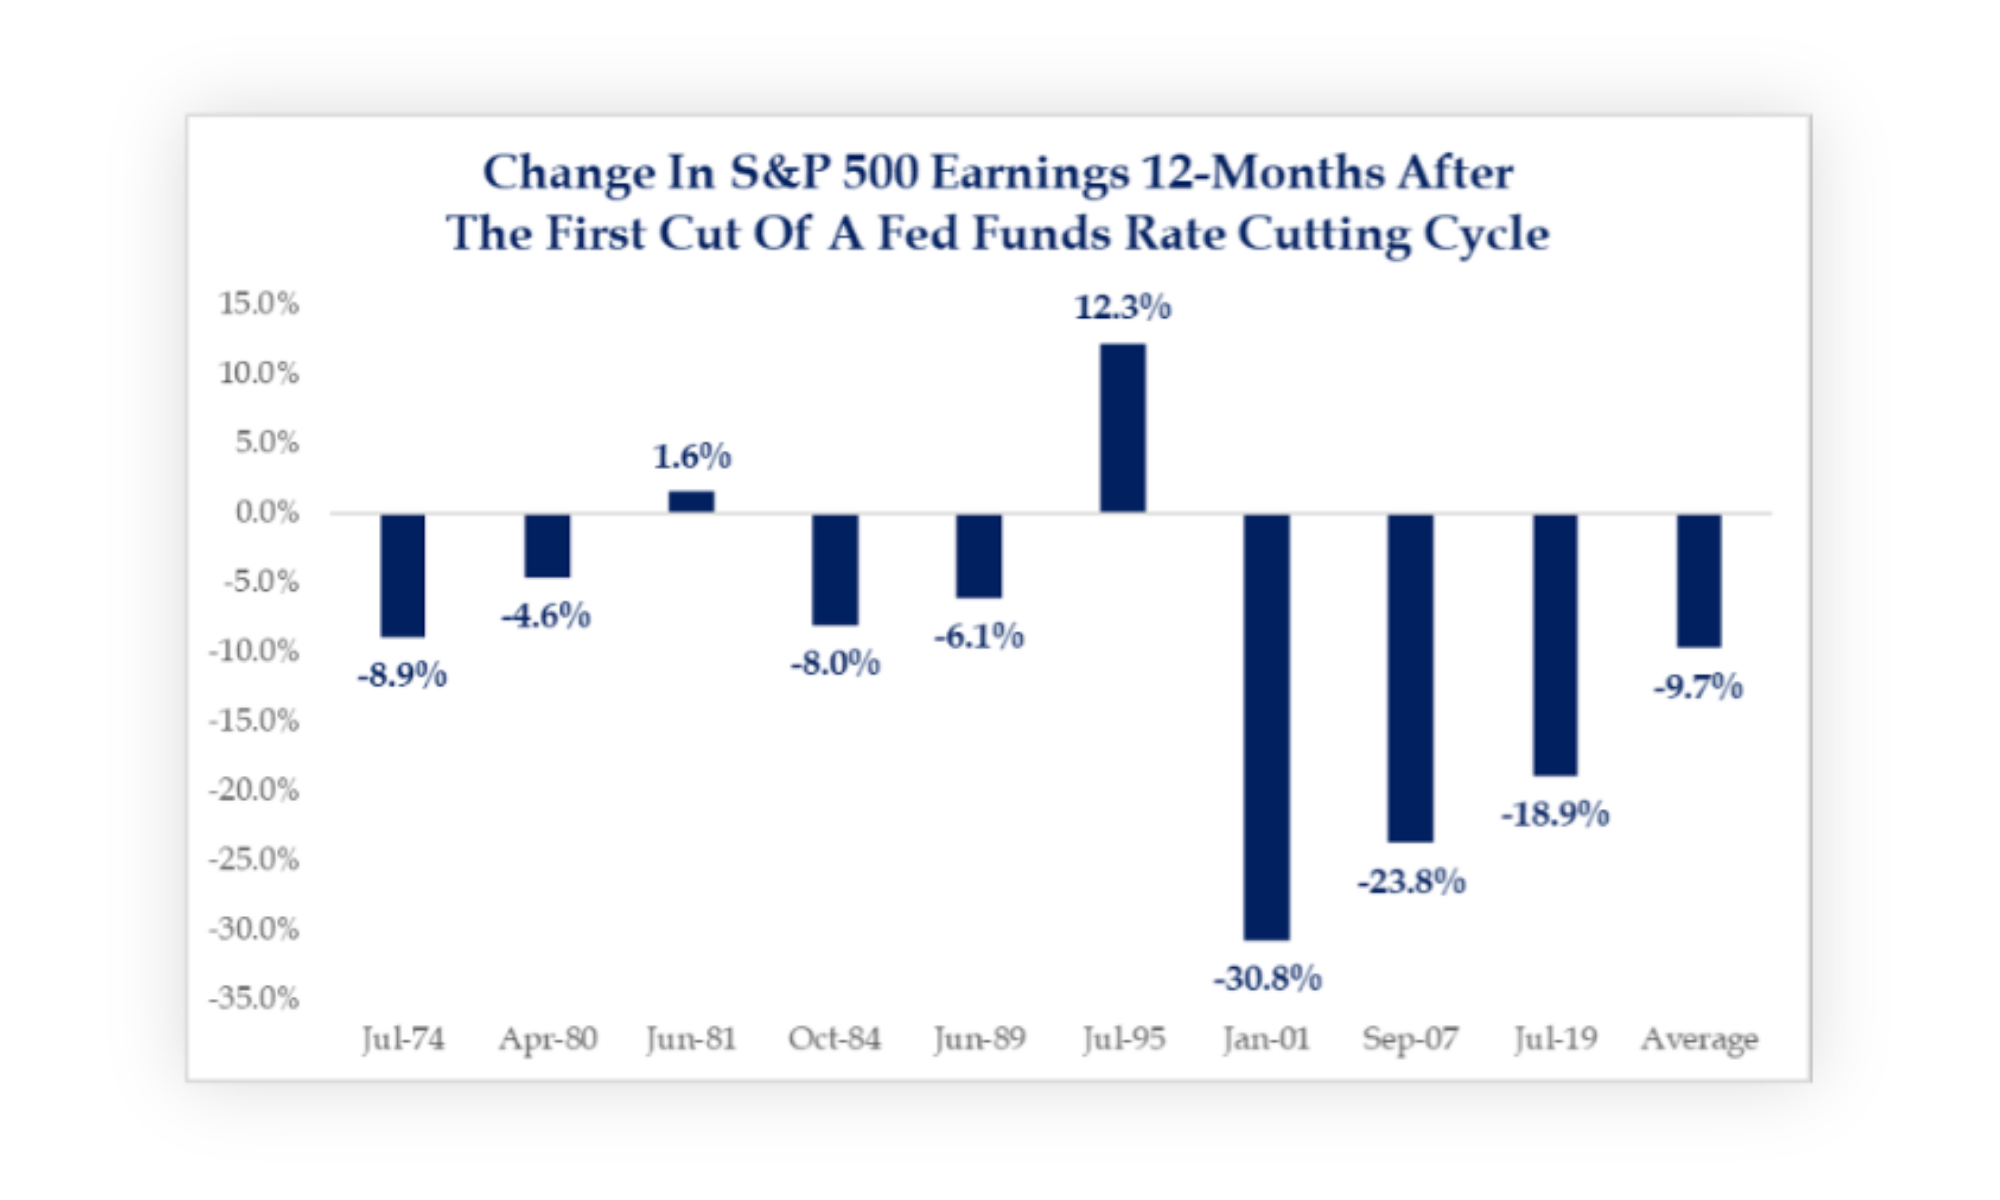
Source: Investment Strategy, May 9, 2024, Strategas Securities, LLC.
Why does this happen? Usually, it is because the economy is already souring before the Fed cuts rates for the first time in a rate-cutting cycle. Despite the Fed’s independence, it is still political in its decision-making, and it is populated by people with well-tuned political instincts. In other words, the Fed is reactive to economic data that has already been released instead of proactive of data that may or may not be. Thus, the Fed lags the official economic data releases – and of course the official economic releases already lag the actual economy. Economic reports are published a month or quarter after the data points occurred. Perhaps the most lagging economic indicator of all is labor data, and the Fed watches the labor markets when deciding on monetary policy. In sum, when the Fed finally cuts rates, the economic data has already deteriorated significantly, and the economy has negative momentum.
Besides, the Fed is seeing some benefit from indicating an inclination to cut rates, which tends to restrict economic behavior. For instance, if a chief financial officer is looking to make a long-term investment or a potential homebuyer wants to buy a home, the notion that rates will drop often postpones behavior (as decision-makers prefer to wait for lower rates).
This is also a good opportunity to clear up some misconceptions about how investors think Fed policy impacts long-term interest rates. Most investors believe a drop in short-term interest rates equates to a drop in intermediate and long-term interest rates. Many assume a parallel shift where a drop of, say, 1% in short-term rates means a drop of 1% in longer-term rates for products such as mortgages. It does not exactly work that way. Short-term rates are managed by the Fed, but longer-term rates are determined by the markets. If anything, a cut in short-term rates tends to be pro-inflationary. Thus, all else being equal, a cut in short-term rates may actually be a prompt for higher long-term rates.
Finally, many investors think inflation is whipped for now and the Fed should cut rates sooner rather than later. Perhaps that is correct, but perhaps not. Inflation may fall in the short term, but it may not in the years ahead. Investing is an exercise in probabilities and possibilities. As Mark Twain said, while history may not repeat, it does rhyme. The recent inflation experience is following a similar path as it did in the 1970s (see chart below), which means additional inflation waves could follow.
While the current environment is different from the 1970s in many ways, there are legitimate reasons to believe a reflationary/inflationary wave could come again. Here’s a laundry list that includes some reasons: deglobalization (including onshoring of manufacturing); increased energy demands due to energy transitions, multi-decade highs in 5-year money supply growth (except for post-COVID money supply growth); increased geopolitical stress translating into higher defense spending; an aging population coupled with anticipated lower immigration (Econ 101 lesson: fewer workers = higher wages); and massive federal debt.
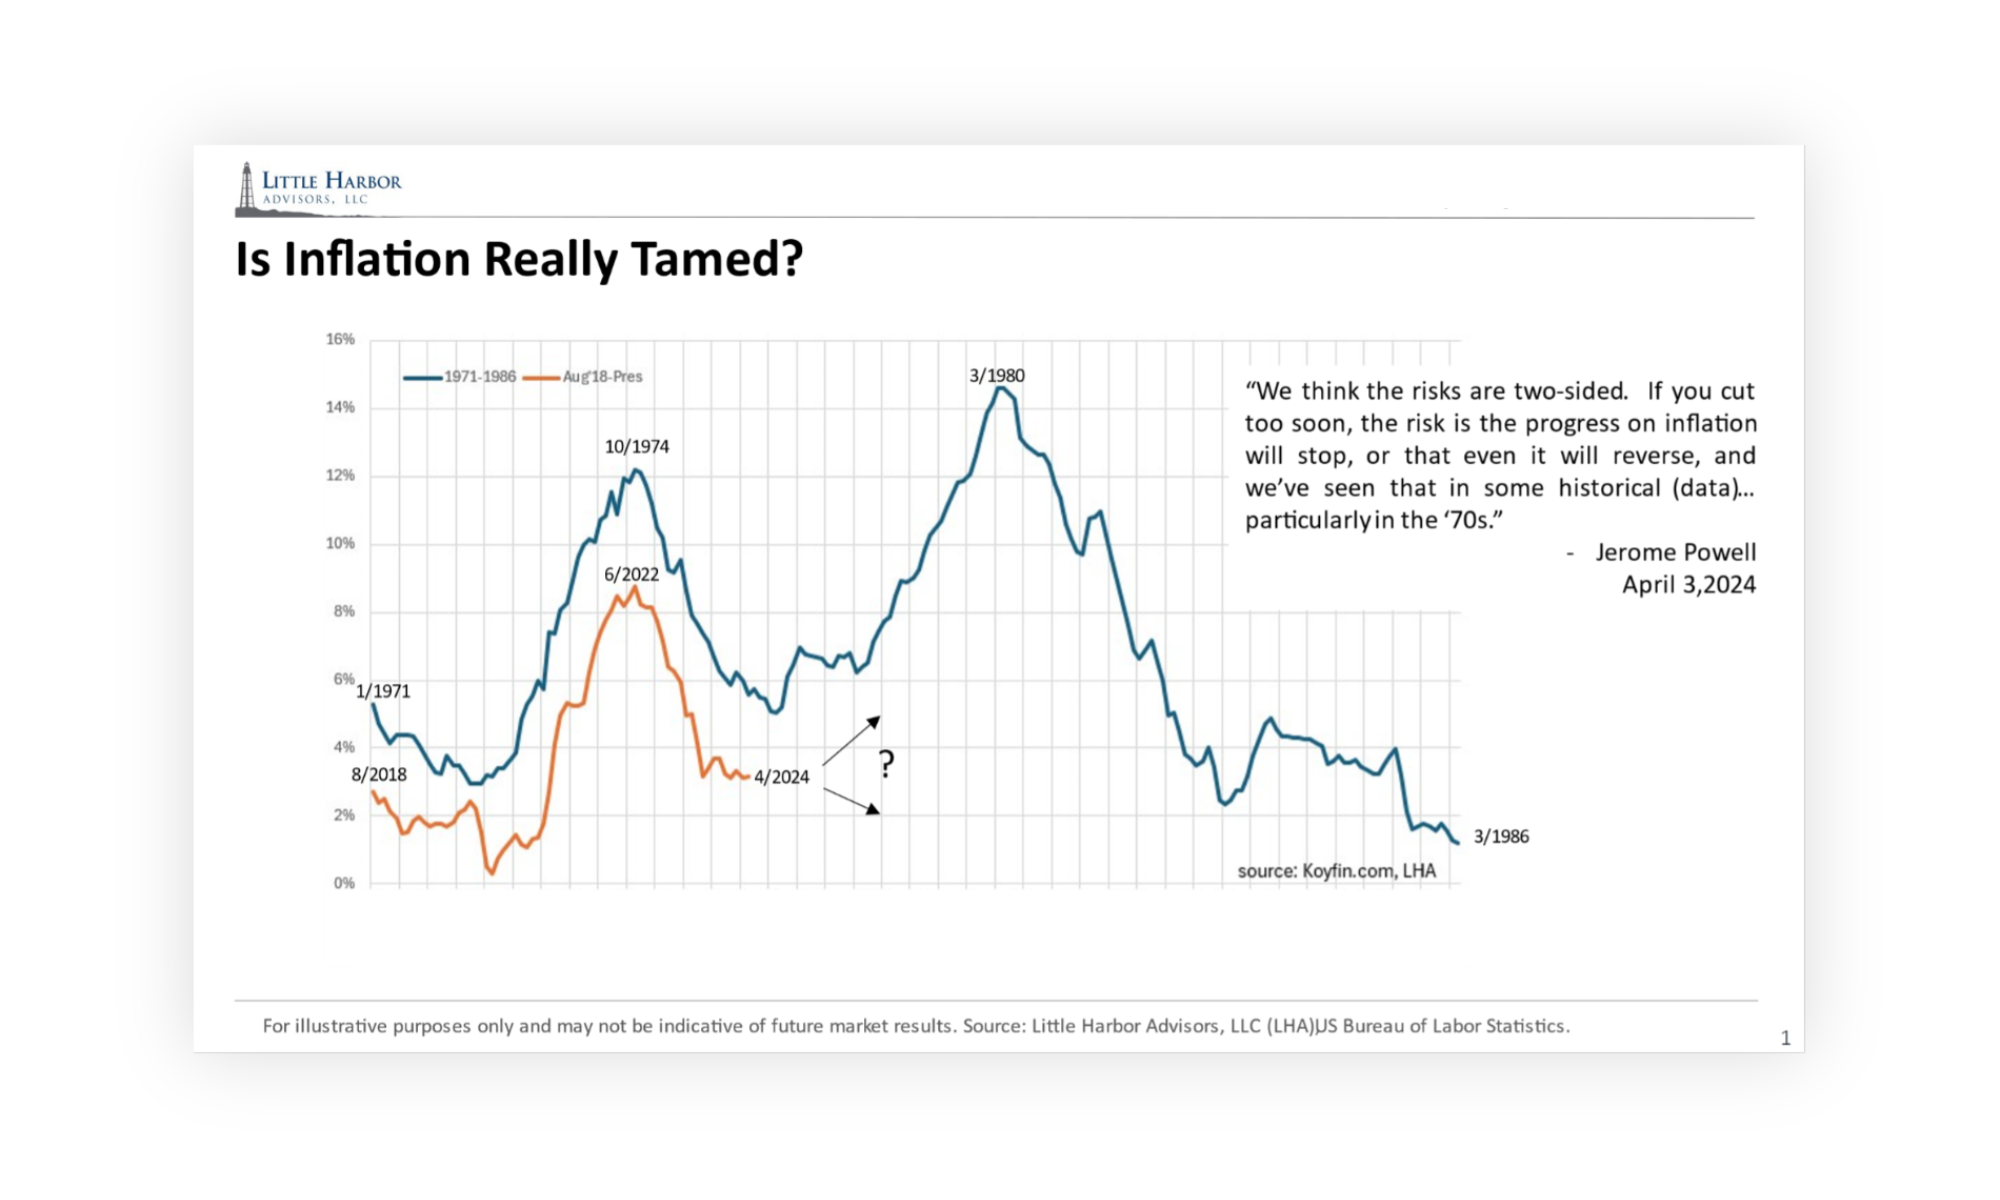
Source: Little Harbor Advisors, LLC (LHA), US Bureau of Labor Statistics.
Should investors bet against history? We believe balanced, diversified portfolios should be built with resilience to weather all economic seasons and be prepared for the possibility of another wave of inflation. In this case, exposure to diversifying asset classes, such as global credit, alternatives, and real assets, do indeed add resilience. This is the case whether the Fed cuts or raises short-term interest rates.
Ask Investors These Questions
Each quarter, OPS produces a Quarterly Reference Guide. One of my favorite pages reviews U.S. stock market historical returns over a variety of time frames, going back to 1871. The data tells multiple stories and helps fortify the arguments for why investors should stay invested and diversified.
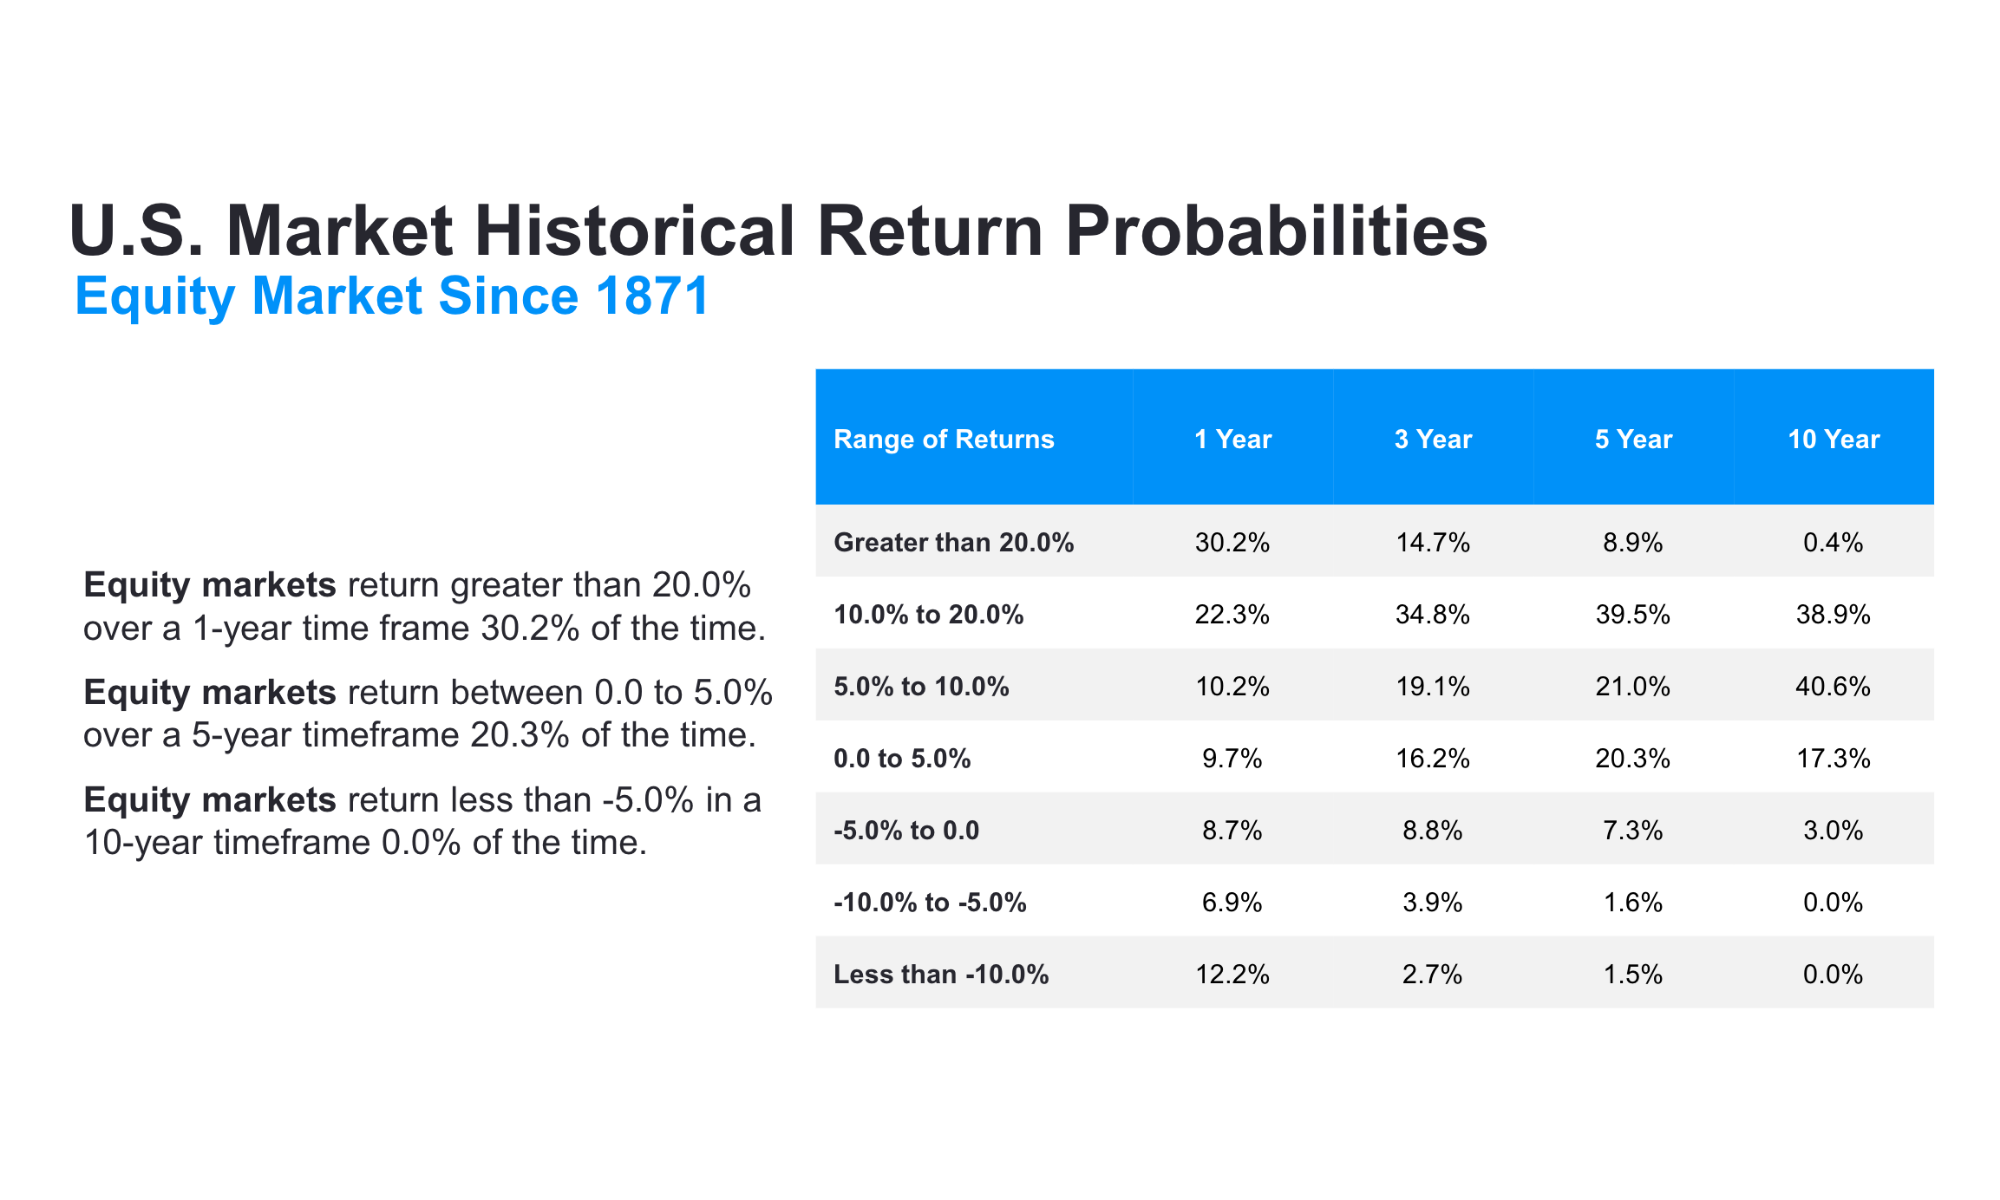
Source: Stock market data is from Yale Professor of Economics Robert Shiller. Numbers range 1871 – 3/31/2024. The sum of the figures may be lesser or greater than 100% due to rounding. As of 3/31/2024. Past performance is not a guide to future performance. Individual client accounts may vary. 1 Year Forward returns matched with valuation quintiles determined by P/E. Breakpoints of 367. Q1: P/E is less than 10.85; Q2: 10.85-13.59; Q3: 13.59-16.32; Q4: 16.32-19.08. Q5: 19.08+.
There is a lot to unpack in this table. Let us first explore the strong positive experience of the stock market. If presenting this data to an audience or an individual investor, first ask how often they think the stock market is down on the year. It is likely the numbers will tend toward 50%. In fact, according to the article “The Negativity Bias and Perceived Return Distributions” from Starks/Sias/Turtle in the Journal of Financial Economics (2023), the median expectation was indeed 50%, with 83% of investors expecting a more negative experience than what has occurred historically. Since 1871, the market has generated negative returns less than 30% of the time.
Next, ask how often they think the market is up more than 20% in a 12-month period. That number is likely to be a lot lower than the actual historical experience of more than 30%.
The same is true when investors are asked for the same numbers over 10 years. According to Starks, et al., only slightly more than 50% believe stock market returns are likely to be higher in price over 10 years. About 96% expect a more negative turn than the historical experience. But, since 1871, the market has only generated negative returns over 10 years about 3% of the time.
Why such a negative bias? There are multiple reasons, including some cited in the aforementioned “Negativity Bias” article, but I believe another key reason is that many investors see higher-frequency market return data than just once a year looking at the 12-month returns. The table below (again from the Reference Guide) shows why this matters. While the stock market is positive more than 70% of the time over a 12-month period, it is higher only 53% on a daily basis and 57% on a weekly basis.
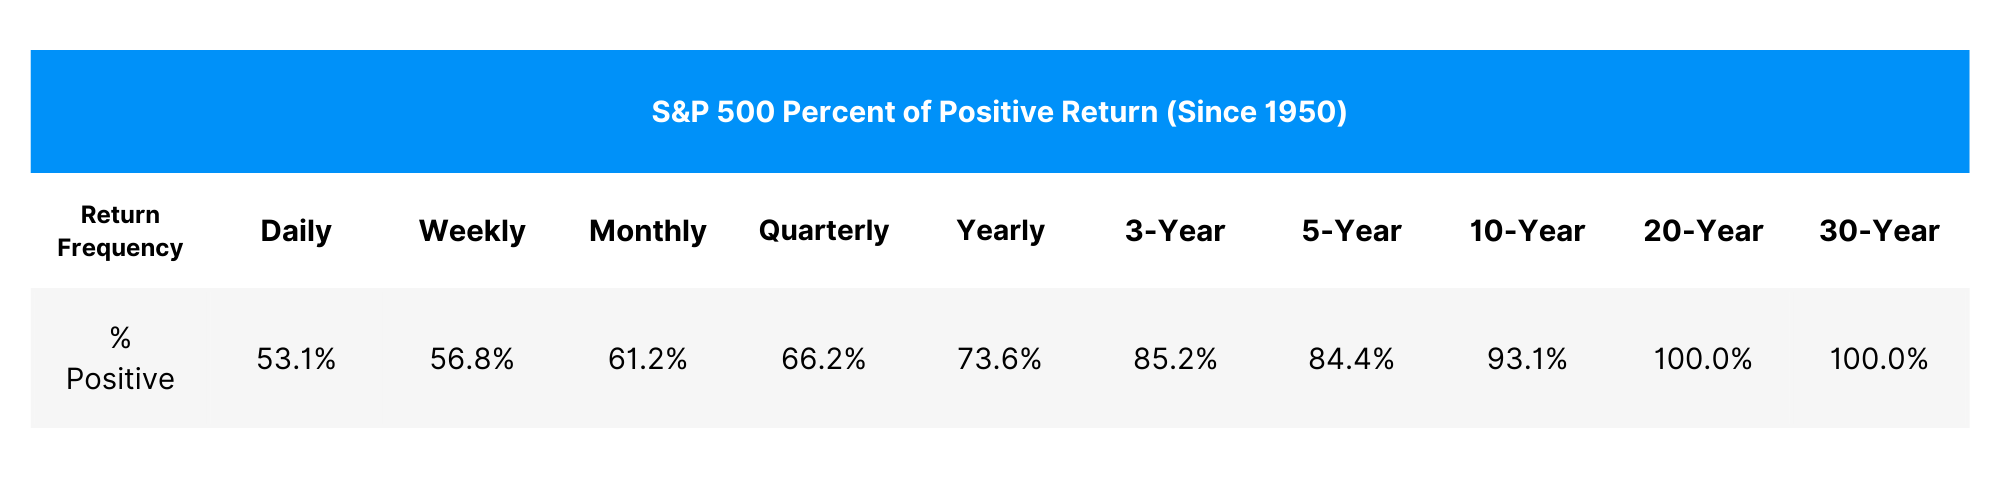
Source: Daily SPX price data from Yahoo Finance as of 3/31/24.
The returns above also show how much more volatile the stock market is in terms of what most investors expect. While Wall Street and investors usually tend to think the stock market will return 5-10% over the next year, that only happens about 10% of the time. For most investors, volatility is destabilizing, even upside volatility. Strong gains and losses can be destabilizing to appropriately balanced portfolios as investors will often want more or less stock market participation. Since the stock market has generated double-digit 12-month returns more than 50% of the time and losses 30% of the time historically, I would argue that approximately 80% of the time balanced portfolios are under siege from investors wanting changes in asset allocations. To counter this, advisors should show their audience how returns tend to move toward the long-term average the longer the time frame. Once an investor gets to the 10-year time frame, for example, historical experience has produced +20% returns less than 1% of the time and a loss about 3% of the time.
Bottom line: Stay invested and stay diversified.
However, how do these numbers change when the stock market is expensive? Currently, the stock market is nearly as expensive as ever, and valuations do matter for stock market returns. That’s true even in the one-year time frame, contrary to what many say, as shown in the table below from the OPS Reference Guide.
U.S. Market Historical Return Probabilities
Equity Market by Valuation Quintile – P/E
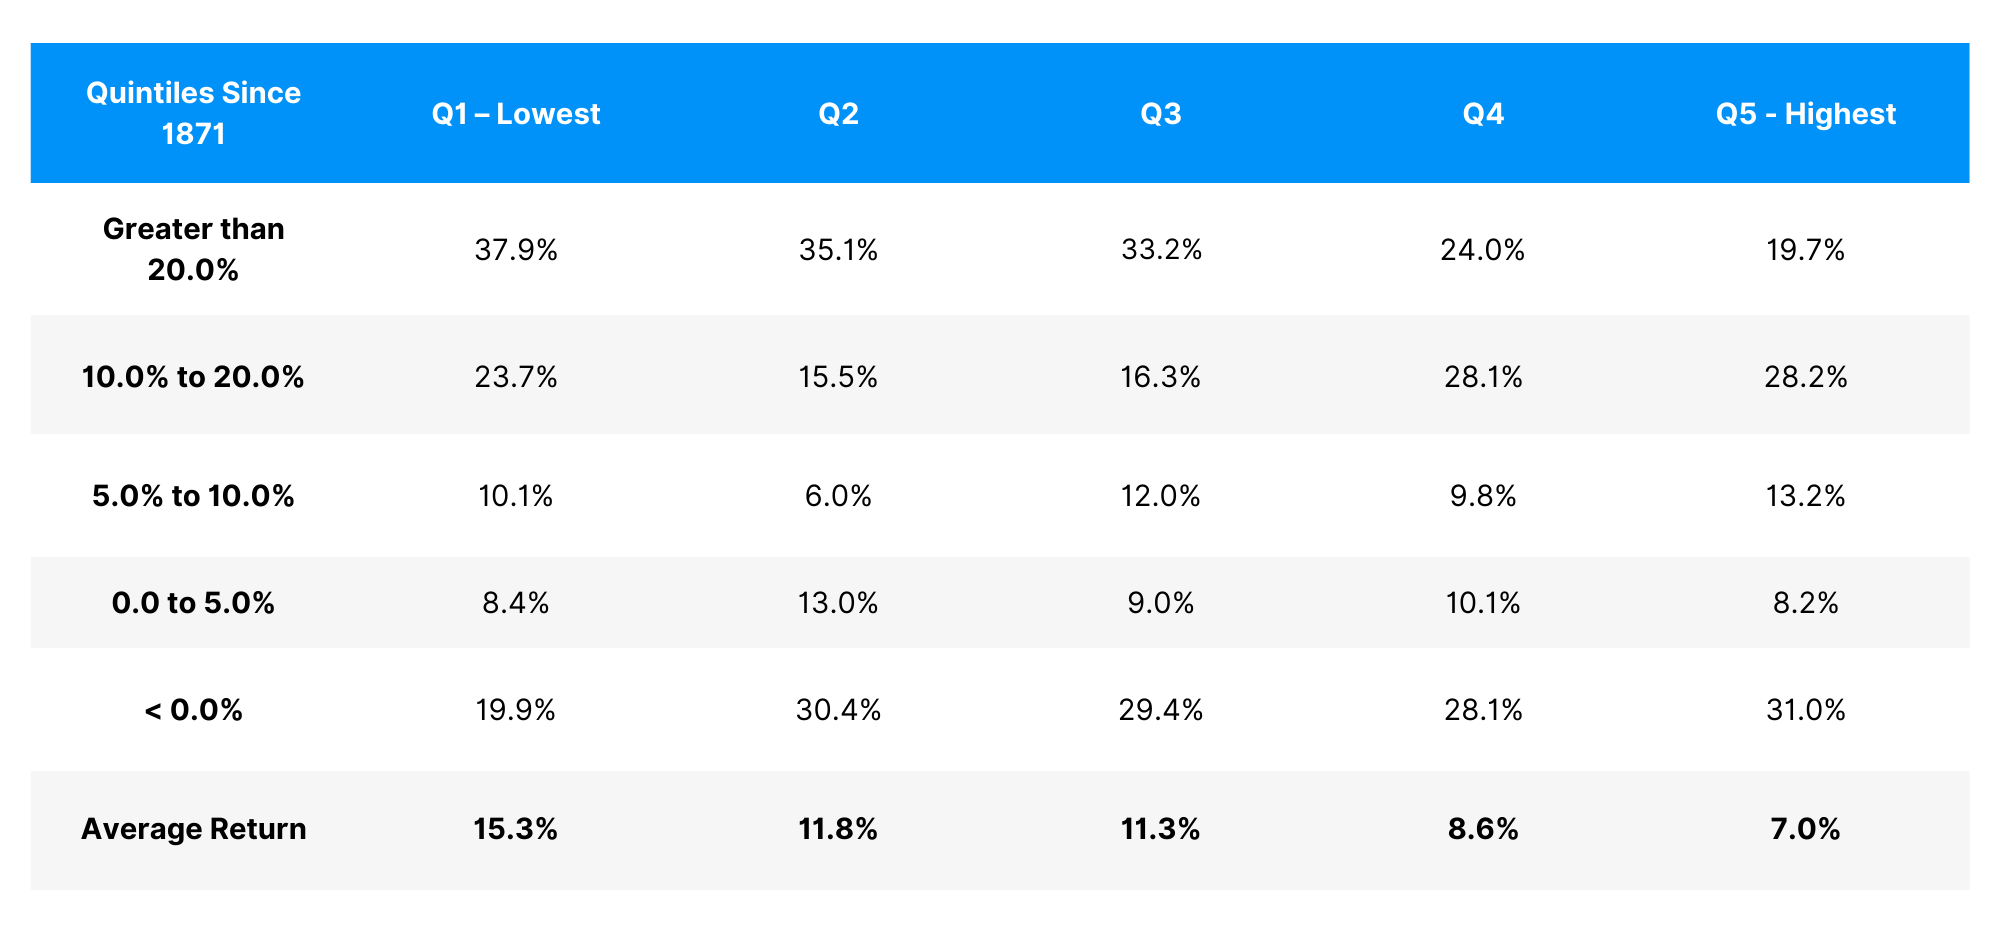
Source: Stock market data is from Yale Professor of Economics Robert Shiller. Numbers range 1871 – 3/31/2024. The sum of the figures may be lesser or greater than 100% due to rounding. As of 3/31/2024. Past performance is not a guide to future performance. Individual client accounts may vary. 1 Year Forward returns matched with valuation quintiles determined by CAPE. Breakpoints of 342. Q1: CAPE is less than 11.25; Q2: 11.25-14.92; Q3: 14.92-17.92; Q4: 17.92-22.37. Q5: 22.37+.
This table of 12-month returns based on valuations reads from left (lowest valuations) to right (highest valuations). The average return at the bottom of the table shows that when valuations are low, the average return has been more than 15% per year. Moving from left to right to review the next quintile of higher valuations, the average 12-month return steadily decreases. The most expensive quintile has an average 7% return. Valuations do matter for one-year returns.
The likelihood of a loss slightly increases when valuations get more expensive, but there is not much difference between the valuation quintiles, except for the lowest where the chance of a loss falls from approximately 30% to roughly 20%. Interestingly, however, valuations are lowest typically when investors have the lowest participation in the stock market.
Bottom line: Stay invested (because the markets go up over time — even when they’re expensive) and stay diversified (because the markets generate volatile returns including big gains and losses).