Notable Performance Points in 2024  |  What Stock Prices Follow Over Time  |  Our Important Twist on Many Advisors’ Favorite Slide 

Portfolio Advice, Talking Points, and Useful Resources

  • A Year in Review: 2024 was an exceptional year for investors and included impressive earnings growth and price returns from the Magnificent Seven.
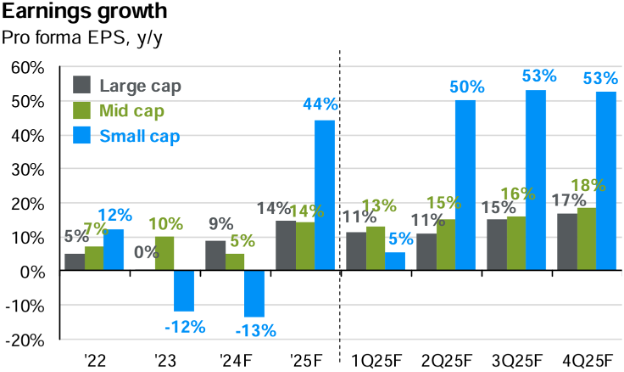
  • Earnings Growth: Stocks follow earnings, and earnings growth could provide clues for future market leadership.
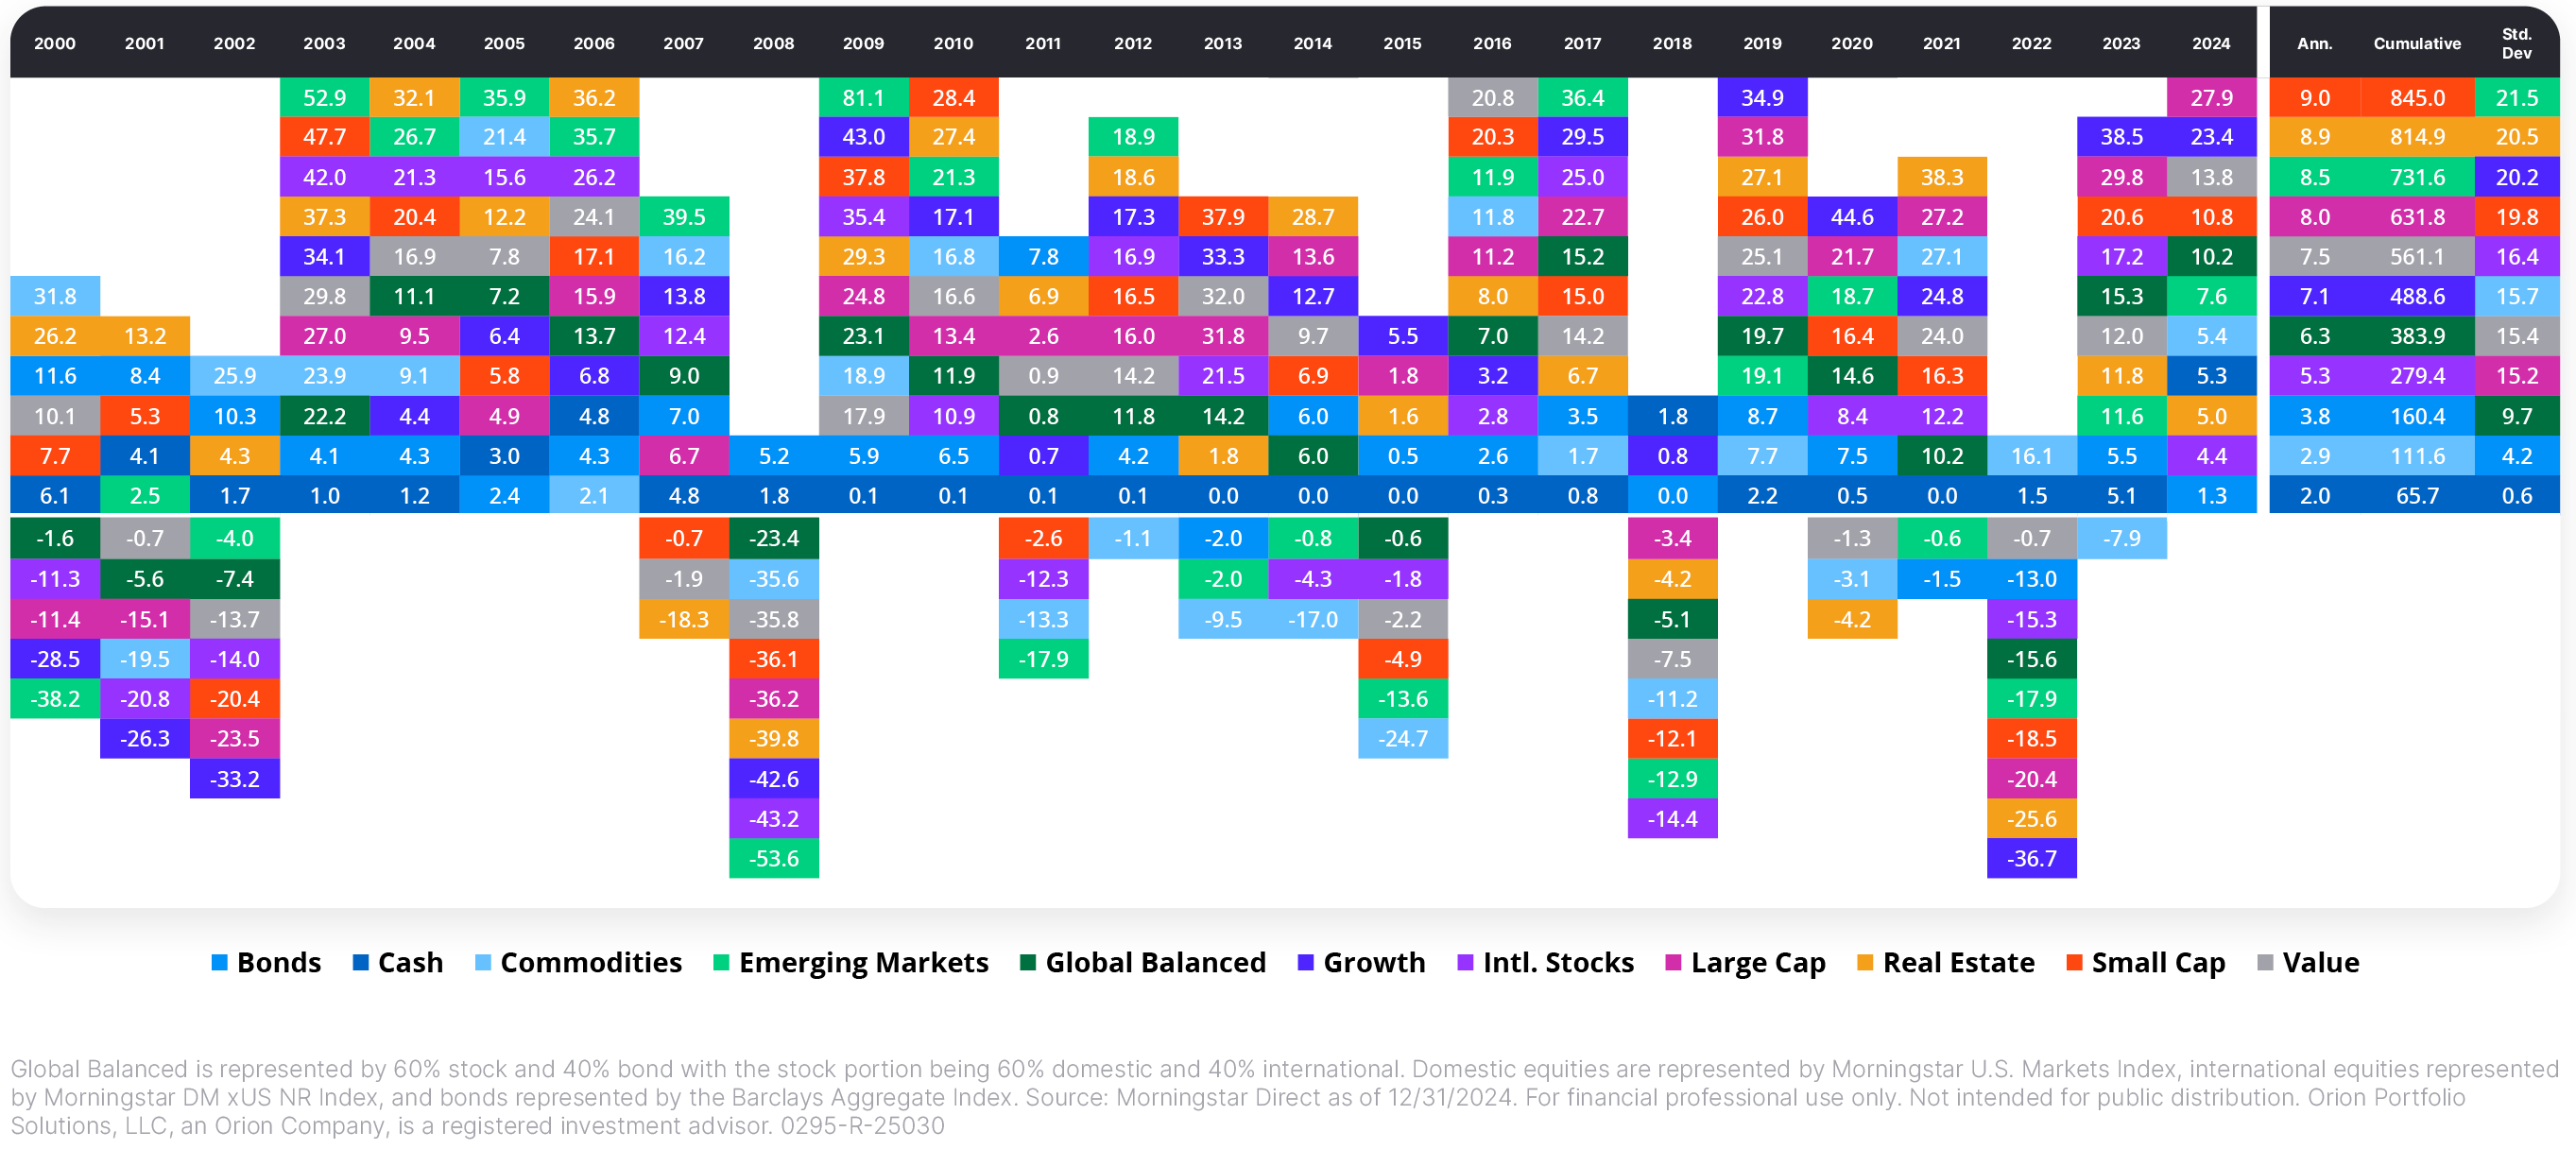
  • Our Twist on a Powerful Slide: The asset class quilt chart is a winner for explaining markets, but it also shows the markets’ powerful positive expectation. Stay invested. Stay diversified. 


Looking Back On 2024

By Rusty Vanneman, CFA, CMT, BFA, Chief Investment Strategist

Five Notable Performance Points in 2024:

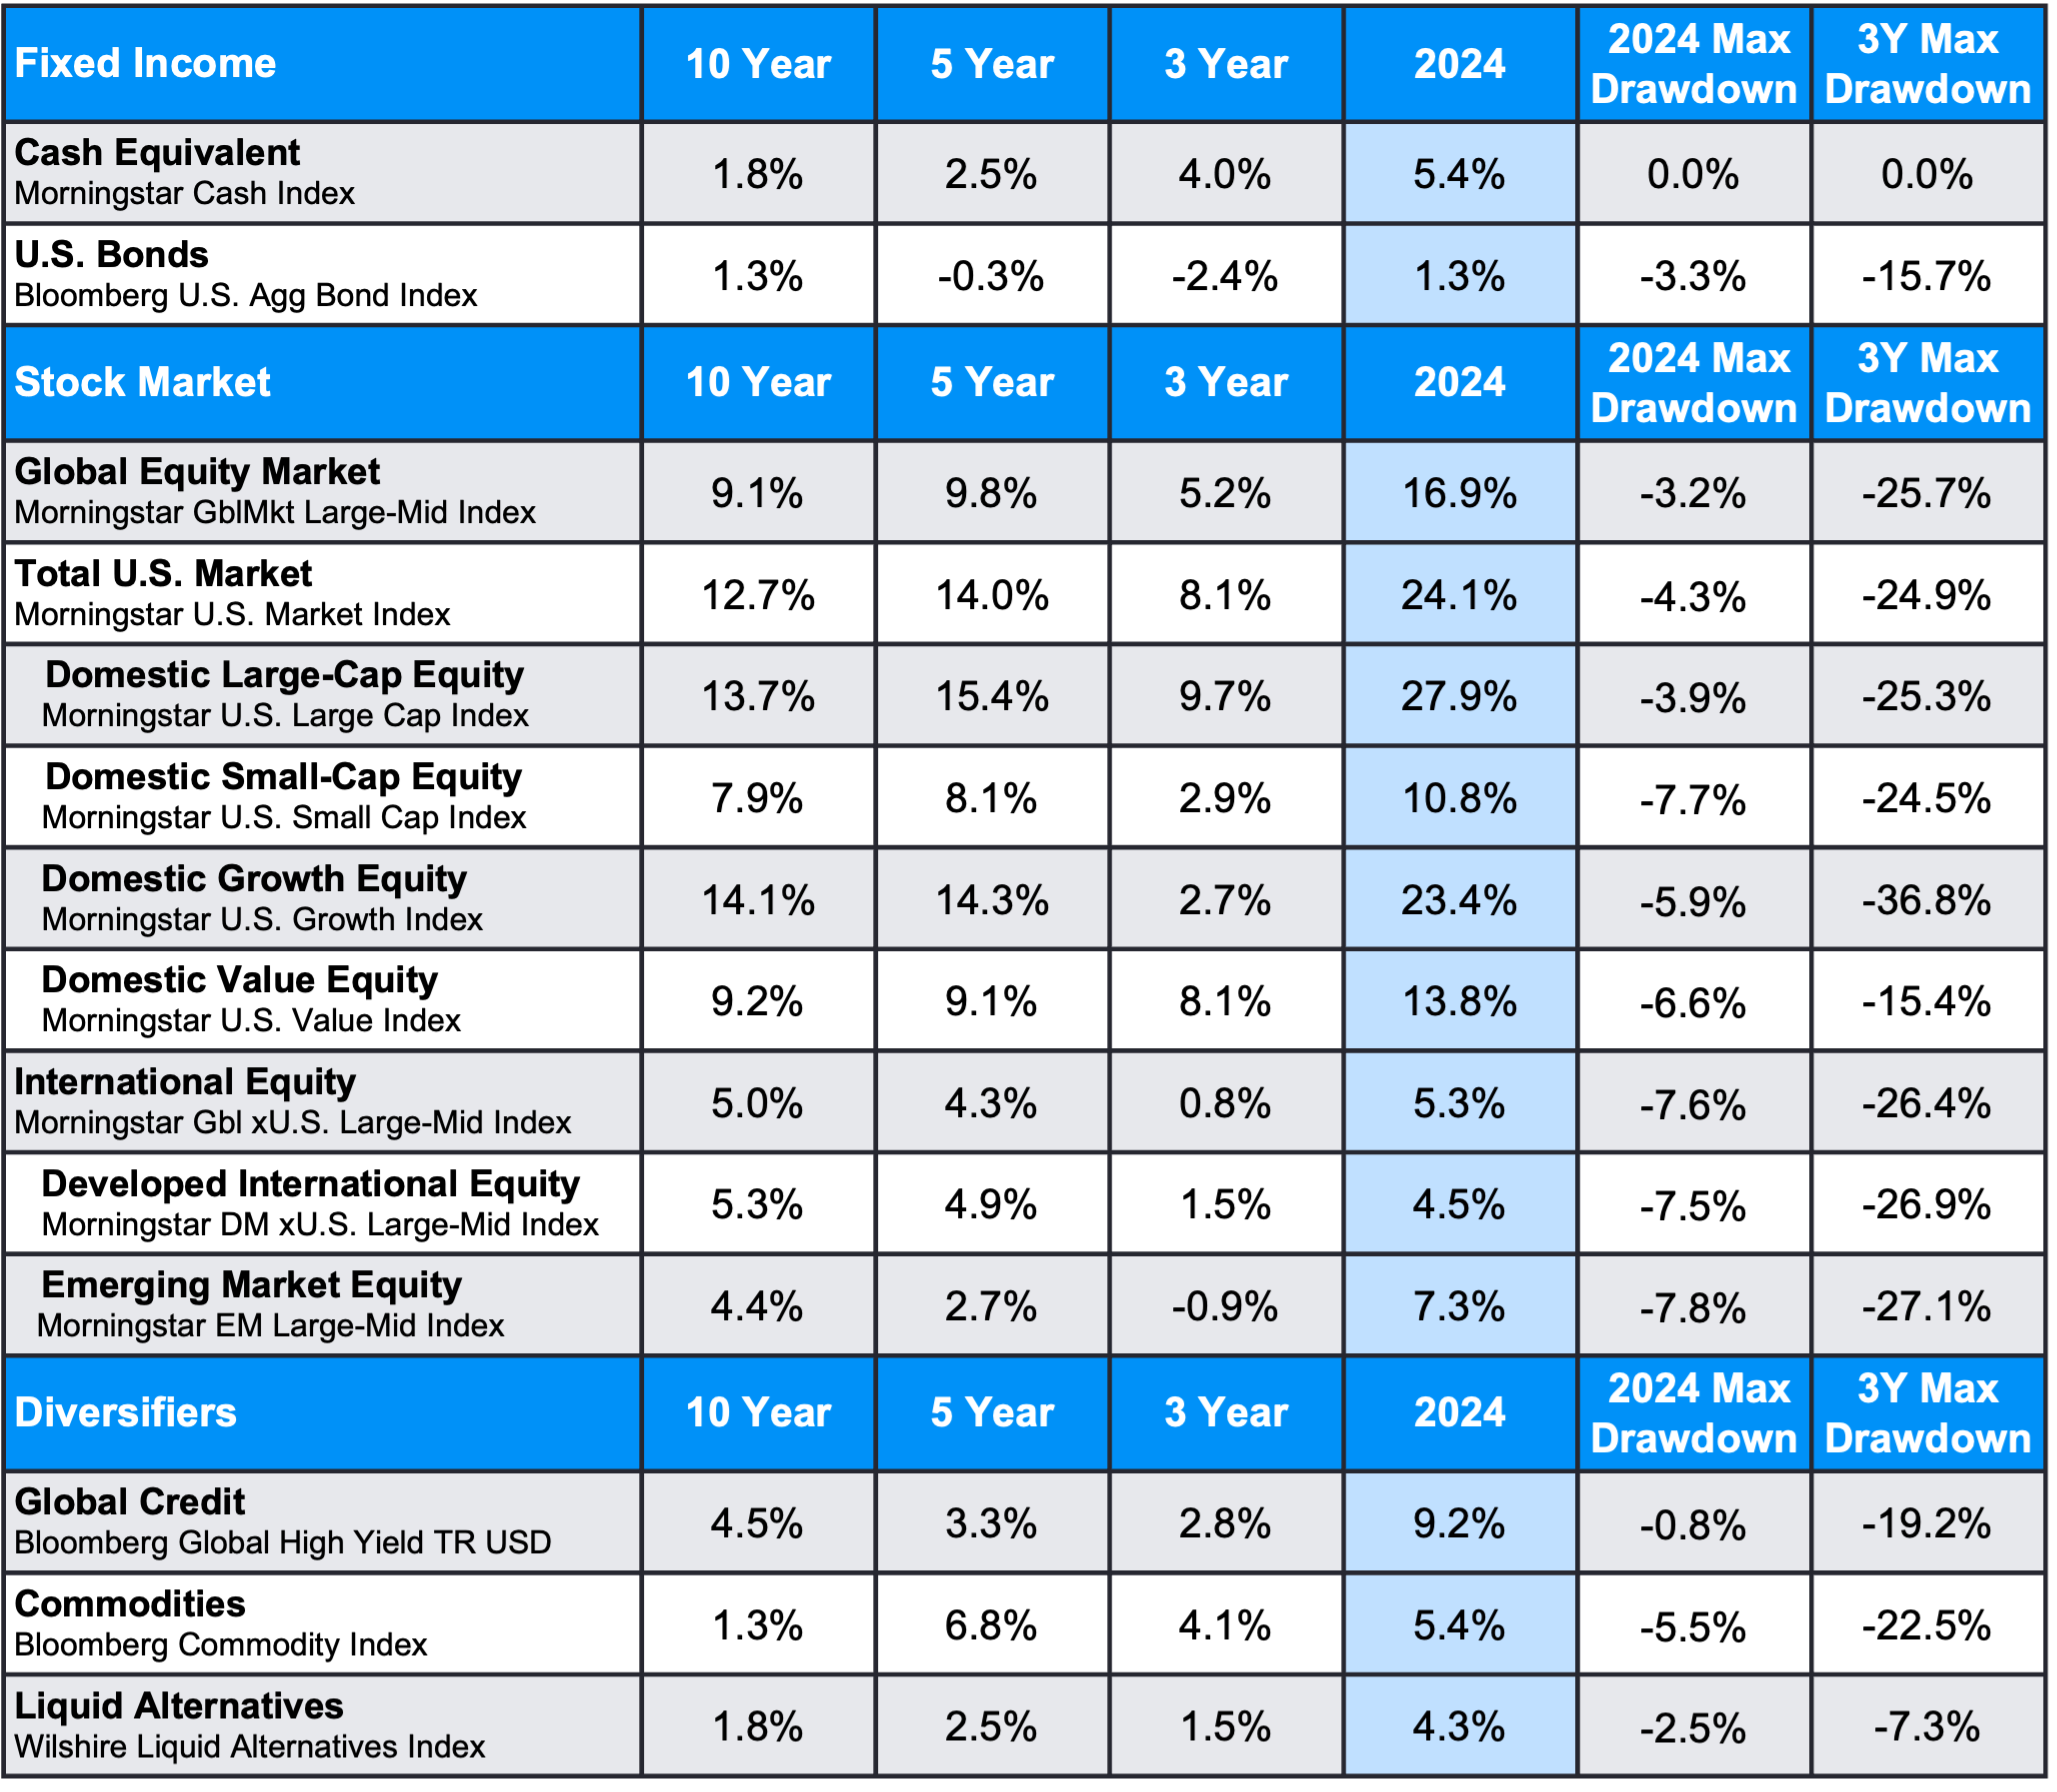
2024 was a strong year for investors in balanced portfolios. U.S. large-cap growth stocks took the spotlight, with the Magnificent Seven delivering price gains of nearly 50%. Reviewing the table of annualized returns below, five key themes emerge from last year’s exceptional performance:

  1. A Good Year by Any Standard
    With historical stock market returns typically in the 8-10% range, 2024’s double-digit gains firmly classify it as a strong year. Large-cap stocks posted a stellar 28%, well above long-term averages.
  2. Large-Caps Outpaced Small-Caps
    Large-cap stocks significantly outperformed small-caps, with returns of 28% versus 11%. This divergence underscores the outsized influence of a handful of dominant growth stocks.
  3. U.S. Stocks Outperformed Global Markets
    Fueled by a strong fourth quarter, U.S. equities surged 24%, while non-U.S. stocks lagged at just 5%. In the final quarter alone, the S&P 500 gained 10%, buoyed by an 8% rise in the U.S. dollar and a sharp increase in long-term interest rates.
  4. Fixed Income Found Positive Ground
    Bonds, as measured by the Bloomberg Aggregate Index, eked out a positive return in 2024. Yet, their three- and five-year annualized returns remain negative — a rarity in the historical record.
  5. Diversifiers Shined
    Diversifying asset classes, such as global credit, real assets, and alternatives, outperformed core fixed income. Over the past three, five, and 10 years, these assets have consistently added value, reinforcing their role as a complement to traditional fixed income for managing equity risk.
     
Performance


The Magnificent Seven Was Indeed Magnificent

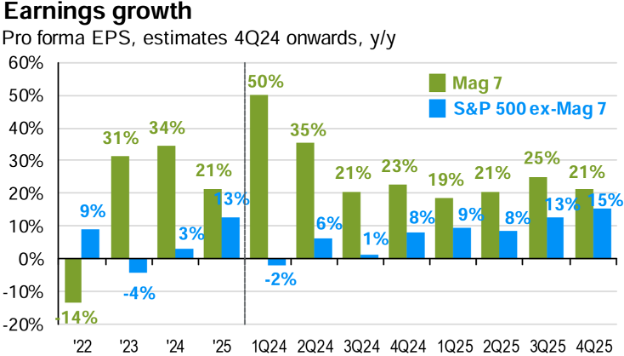
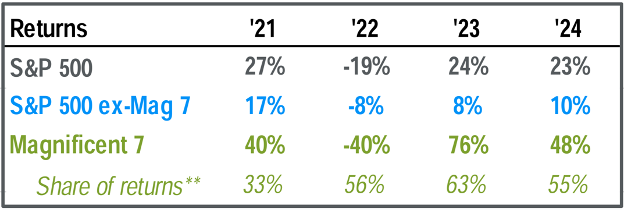
Large-cap stocks’ extraordinary performance in 2024 was driven by the Magnificent Seven (M7): Alphabet, Amazon, Apple, Meta, Microsoft, NVIDIA, and Tesla. Their returns were nothing short of remarkable.

In 2024, the S&P 500 gained 23% in price terms, while the Magnificent Seven delivered a staggering 48% price return. Strikingly, if you exclude these seven stocks, the S&P’s price return drops to 10%. Though still solid, it pales in comparison to the M7’s contribution. This pattern has continued for several years, with the M7 outperforming the broader market in three of the last four years.

Magnificent7

Source: J.P. Morgan Guide to the Markets, page 12. As of 12/31/2024. 
**Share of returns represent how much each group contributed to the overall return. Numbers are always positive despite negative performance in 2022.
 

Get Your Own Market Commentary

Client-Friendly Weekly Wire

Want a version of Weekly Wire you can send directly to your clients? Subscribe to our Weekly Wire newsletter and get a client-friendly version every Monday. Simply download, add your firm's logo, and use with your clients!


What Stock Prices Follow

By Rusty Vanneman, CFA, CMT, BFA, Chief Investment Strategist

Stock Prices Follow Earnings

Over time, stock prices follow earnings, and there is a reason the Magnificent Seven outperformed: earnings growth.

In 2023 and 2024, the Magnificent Seven’s earnings growth far outpaced the S&P (ex-M7) growth rate. In 2024, the average M7 earnings growth was 34%, while the S&P 500’s growth ex-M7 was only 3%. In 2023, the differences were even larger: 35% versus a negative 3%. In 2025, at this point, the M7 is still expected to have faster earnings growth: 21% vs. 13%, but those differences are likely to decrease heading into the back half of 2024.

It's important to note that the stock market typically leads earnings growth by six to 12 months. Looking ahead to 2025, could this narrowing gap set the stage for more balanced performance?

Earnings Growth

Source: J.P. Morgan Guide to the Markets, page 12. As of 12/31/2024.


Small-Caps: Poised for a Comeback?

Let us look at the stock market in another way: breaking it down into large-caps, mid-caps, and small-caps. A rule of thumb is that large-caps make up 70% of the overall market’s capitalization, mid-caps 20% and small-caps 10%. 

While large-caps have dominated in recent years, small-caps may be preparing to rebound. Earnings growth is a key reason for their recent underperformance. In 2024, small-cap earnings contracted by 13%, compared to 9% growth for large-caps. That was a win for large-caps. 

However, the outlook for 2025 is brighter. Small-cap earnings are forecasted to grow by an impressive 44%, compared to 14% for large- and mid-caps. If these forecasts materialize, small-caps could finally reclaim leadership.

Earnings Growth 2

Source: J.P. Morgan Guide to the Markets, page 13. As of 12/31/2024.


Market Concentration: A Cautionary Tale

The success of the Magnificent Seven has led to unprecedented market concentration. Historically, peaks in market concentration have coincided with short-term market peaks.

Market concentration can be identified in multiple ways, but each method tells the same story. The chart below shows a market concentration statistic showing the largest stock’s overall market capitalization versus the 75th percentile stock’s market capitalization. Interestingly, this trend goes back to the 1920s and shows that concentration peaks often coincide with short-term peaks in the market.

Like much in the markets, concentration can trend in the short term but also mean revert over time. Everything is cyclical. 

Market Concentration


The Average Stock 

The performance gap between market-cap-weighted indices and equal-weighted indices is another measure of concentration. At the end of 2024, market-cap-weighted indices were outperforming equal-weighted indices by the widest margin in 50 years. Also noteworthy is the average stock has outperformed most of the time during this period. Could the end-of-2024 peak signal a shift in favor of the average stock in 2025? This could spur a comeback for active managers, who tend to allocate more equally across stocks.

Average Stock

Source: Return data from Morningstar. Data ranges from 1/1/1972-12/31/2024.
Indices used: S&P 500 TR USD & S&P 500 Equal Weighted TR USD. 


The U.S. vs. the World

The U.S. stock market has outperformed global markets for more than a decade, thanks to stronger earnings growth, greater exposure to technology, and the dominance of the Magnificent Seven. The dollar’s strength has also been a tailwind.

However, performance leadership between U.S. and non-U.S. markets is cyclical. While the dollar’s recent surge has weighed on non-U.S. stocks, a reversal in the dollar’s trend could support international markets moving forward.

US Equity vs International

Source: Hartford Funds, as of 12/31/2023.


Fixed Income: Perspective on Yields

One reason the U.S. dollar is strengthening is rising interest rates, which were another defining feature of 2024. By year-end, 10-year Treasury yields were near their highest levels in 17 years.

Yet, from a historical perspective, rates remain below long-term averages. Since 1958, the average 10-year nominal yield has been 5.7%, compared to 4.6% at the end of 2024. Inflation and inflation-adjusted yields also remain below their historical averages. The table below highlights these numbers.

This suggests that while rates feel high relative to the post-financial-crisis era, they are not historically extreme. Does this mean that rates are going higher? Not necessarily, but further rate increases could support the dollar and U.S. equity outperformance. 

10 Year Treasury Yields
Source: J.P. Morgan Guide to the Markets, page 34. As of 12/31/2024.


Animal Spirits

One of the most remarkable aspects of 2024 was the sustained bullish sentiment among investors. Surveys revealed unprecedented optimism about U.S. stocks heading into 2025. In one study for instance, U.S. investors were more bullish than they had ever been on the prospects for the U.S. stock market in the following year.

As seen in the chart below, the AAII Investor Sentiment Survey recorded its highest percentage of net bullish weeks this century. The data series goes back to 1987, and only 1999 revealed such consistent bullishness. 

Bullish Weeks
Source: AAII Sentiment Survey, as of 12/31/2024


Looking Ahead

2024 was a banner year for balanced portfolios, with exceptional performance across equities and select diversifiers. As we enter 2025, the seeds of continued earnings growth are in place, suggesting the potential for another strong year.

That said, shifts in market leadership — whether from large-caps to small-caps, from market-cap-weighted indices to equal-weighted ones, or maybe even from U.S. to international markets — could make 2025 a year of transitions. As always, diversification and disciplined portfolio management remain essential to navigating what lies ahead.


Our Twist on Many Advisors’ Favorite Chart

By Nolan Mauk, BFA, Research Analyst at Orion

Despite a tumultuous December, 2024 was an exceptional year for diversified portfolios. Every major asset class posted positive returns on the year for the first time since 2019. U.S. large-caps and growth stocks led the way, but U.S. value stocks and small-caps both posted returns of more than 10%. Globally balanced portfolios (60% global equities, 40% bonds) were up more than 10% for their second straight year.

As we enter 2025, investors may be looking at certain negative indicators, such as extended equity valuations, rising yields, and geopolitical tension, and wondering if markets have the right environment to continue their strength into the near future. As the first quarter of the 21st century nears its close, let us look back at how the major asset classes have performed each year and analyze the benefits of asset class diversification.

The chart below from our Quarterly Reference Guide shows how the major asset classes have performed each year from 2000-2024. The area on the far right shows the annualized and cumulative returns over that time, as well as annualized standard deviation.

Quilt Chart

Source: Morningstar Direct as of 12/31/2024

Several takeaways from this chart highlight the benefits of asset class diversification over time. When reviewing the top and bottom performers each year, make sure to also examine the dark green square (globally balanced portfolio) to see the impact of diversification.


The Power of Positive Expectations
This quilt chart is a favorite tool among many advisors and investors for illustrating the power of balanced, diversified portfolios. At Orion, our quilt chart offers a key difference that sets it apart: While most quilt charts are simply a grid of returns, ours clearly distinguishes when respective asset classes show gains above 0% and when they incur losses.

Notably, most asset classes are above the 0% line, demonstrating a strong likelihood of posting positive returns in most years. Investing is not a zero-sum game; there are more winners than losers.

This chart is not only a compelling case for diversification but also a powerful endorsement of investing as a strategy for long-term success.


The Role of Diversifying Asset Classes

In the context of just the past two years, diversifying asset classes, including bonds and real assets, such as commodities and real estate, have not appeared to be beneficial to portfolios. However, when taking a broader view of the last 24 years, their value becomes more apparent. While global equities have had extreme highs and lows, not a single year has passed in which every asset class has declined. In the worst years for stocks (2000-03, 2008, 2018, and 2022), diversifying asset classes have helped to mitigate the losses for globally balanced portfolios, providing an annual return that is more easily stomached by investors. Even the lowest performing asset class of the century so far, commodities, has pulled through for investors in tumultuous markets on numerous occasions.


Regime Changes

Over this period, certain growth asset classes have gone through extended cycles of relative outperformance and underperformance. For example, in the first decade of the century, emerging and developed international markets outperformed the U.S. market on a consistent basis, value stocks in the U.S. outperformed their growth counterparts for an extended period, and small-caps somewhat consistently outperformed large-caps. More recently, that regime changed, and the last decade has been dominated by U.S. large-caps and growth stocks. Active management can help enhance short-term returns to balanced portfolios throughout these cycles of outperformance. But over the long term, a diversified mix of growth assets helps portfolios capitalize on areas of the market that are working in the current environment.


Cumulative Returns: Starting Points Matter

Turning our attention to the summary columns on the right side of the chart, recency bias may cause us to be surprised at the order of asset class returns from the beginning of the century. Real estate, small-caps, and emerging markets have produced the highest returns over this full period and value stocks have outperformed growth stocks by nearly 50 basis points per year. Those top performing asset classes have been relatively out of favor in recent years, but long-term investors who remained invested across asset classes have benefited from their compounding returns over time. All three of those top performing asset classes have seen periods of extreme volatility and loss, but over time they have outperformed for investors. That brings us to the last major takeaway from this chart: Diversification can help investors stay afloat in tumultuous markets.


Benefits of Diversification: Lower Standard Deviations

Standard deviation is a key measure of risk for portfolios and can help investors come to terms with their exposure to so-called tail events, or the potential extremes they may experience to the upside or downside over the short term. From a portfolio perspective, lower correlations between asset classes cause the portfolio standard deviation to be lower than the average standard deviation of its assets. Since 2000, the globally balanced portfolio has had a standard deviation of 9.7%, which is only higher than bonds and cash, providing a much smoother ride for diversified investors. Staying invested throughout market cycles is key to building wealth over the long term, and the risk benefits of diversification may help investors stick to their plans during highly volatile markets. 
 

Thank You for Letting Us Serve You

Thank you for your time and trust. If you have any questions or feedback, please let us know. 

Stay invested, stay diversified, and stay disciplined.

Invest well and be well. 

Rusty Vanneman, CFA, CMT, BFA
Chief Investment Strategist
rusty@orion.com
strategists@brinkercapital.com


More Market Commentary

Want More Resources?

Unlock a wealth of market commentary resources from Rusty Vanneman, Chief Investment Strategist, and the rest of the Investments team.

The views expressed herein are exclusively those of Orion Portfolio Solutions, LLC, an Orion Company, a registered Investment Advisor, and are not meant as investment advice and are subject to change. Information contained herein is derived from sources we believe to be reliable, however, we do not represent that this information is complete or accurate and it should not be relied upon as such. This information is prepared for general information only. It does not have regard to the specific investment objectives, financial situation, and the particular needs of any specific person. 

The CFA® is a globally respected, graduate-level investment credential established in 1962 and awarded by CFA Institute — the largest global association of investment professionals. To learn more about the CFA charter, visit www.cfainstitute.org

The CMT Program demonstrates mastery of a core body of knowledge of investment risk in portfolio management. The Chartered Market Technician® (CMT) designation marks the highest education within the discipline and is the preeminent designation for practitioners of technical analysis worldwide. To learn more about the CMT, visit https://cmtassociation.org/.

Think2perform’s Behavioral Financial Advice program integrates traditional finance practices with psychology and neuroscience to improve emotional competency and decision-making behavior that increases effective usage of the financial plan with clients. To obtain the Behavioral Financial Advisor (BFA) designation, participants must complete a self-directed course, which takes 20-30 hours to complete, and includes a mix of interactive exercises, videos and case studies. To learn more about the BFA, visit https://www.think2perform.com.

An index is an unmanaged group of assets considered to be representative of a select segment or segments of the market in general, as determined by the index manager for the purposes of managing a specific index. You cannot invest directly in an index.

The Morningstar Cash Index is an index that measures the performance of a Treasury Bill with six to eight weeks until maturity in the U.S. market.

The Bloomberg Barclays US Aggregate Bond Index measures the performance of the total United States investment-grade bond market. 

The Morningstar Global Market Large-Mid Index is an index that measures the performance of the global market’s equity markets targeting the top 90% of stocks by market capitalization.

The Morningstar U.S. Market Index is an index that measures the performance of U.S. securities and targets 97% market capitalization coverage of the investable universe. It is a diversified broad market index.

The Morningstar U.S. Growth Index is an index that tracks the performance of stocks that are expected to grow at a faster pace than the rest of the market as measured by forward earnings, historical earnings, book value, cash flow and sales.

Morningstar Global ex U.S. Large-Mid Index is an index that measures the performance of Global Markets (ex-U.S.) equity markets targeting the top 90% of stocks by market capitalization.

The Morningstar DM ex U.S. Large-Mid Index is an index that measures the performance of developed markets ex-U.S. equity markets targeting the top 90% of stocks by market capitalization.

The Morningstar EM Large-Mid Index is an index that measures the performance of emerging markets targeting the top 90% of stocks by market capitalization.

The Bloomberg Commodity Index is made up of 22 exchange-traded futures on physical commodities and represents 20 commodities that are weighted to account for economic significance and market liquidity.

The Morningstar U.S. Small Cap Index is an index that measures the performance of U.S. small-cap stocks. These stocks fall between the 90th and 97th percentile in market capitalization of the investable universe. In aggregate, the Small Cap Index represents 7% of the investable universe

The Morningstar Global Real Estate Index is an index that tracks the performance of companies engaged in multiple real estate activities, including development, sales, management, and related services. It excludes companies classified in real estate development and real estate services. This index does not incorporate Environmental, Social, or Governance (ESG) Criteria.

The Morningstar U.S. Value Index is an index that is designed to provide consistent representation of the value segment of the US equity market, with no overlapping constituents across styles. Aligned with the Morningstar Style Box™, the index is underpinned by a 10-factor model that paints a holistic picture of style.

The Wilshire Liquid Alternatives Index is an index that provide a representative baseline for how the liquid alternative investment category performed as a whole. It measures the collective performance of the five Wilshire Liquid Alternative strategies that make up the Wilshire Liquid Alternative Universe.
The Morningstar U.S. Large Cap Index is an index measures the performance of US large-cap stocks. These stocks represent the largest 70 percent capitalization of the investable universe. This Index does not incorporate Environmental, Social, or Governance (ESG) criteria.

The S&P 500 Index is an unmanaged composite of 500-large capitalization companies. This index is widely used by professional investors as a performance benchmark for large-cap stocks.