Weekly Notes from Tim

By Tim Holland, CFA, Chief Investment Officer

  • My investment career is more rooted in equities than bonds…before joining Brinker Capital and Orion in investment strategist and investment officer roles I spent 17 years working on long / short and long only US equity funds. And while I still find the equity markets fascinating, I also have a deep appreciation and deep respect for the importance and scale of the fixed income markets, both domestically and globally and corporate and government (and as any professional fixed income investor will tell you, everyone knows that bond investors are a lot smarter than equity investors). So it is with deep humility that I take pen to paper this week.  
     
  • It seems, knock on wood, that bonds are back. According to Morningstar, as of Thanksgiving the iShares Core U.S. Aggregate Bond ETF has returned 7.64% year to date on a total return basis; if that rate of return holds through year-end, it will be the ETF’s best showing since 2019, when it gained 8.46% and a far cry from the negative 1.77% and negative 13.02% returns it posted in 2021 and 2022, as bonds were hit hard by surging inflation and a Federal Reserve that was taking the Fed Funds Rate from 0% to 5%+ (see chart). Also, importantly, high quality fixed income was flat in November, helping to offset that month’s stock market volatility.  
     
  • As to why bonds have caught such a bid this year, we think inflation moving sideways to down, two interest rate cuts from the Fed and a likely third cut at the Fed’s December meeting, solid but not too hot economic growth and the US dollar finding its footing are all likely catalysts. And as to where fixed income heads from here, much will depend on investor demand, and the path forward for inflation, interest rates and the economy. But for now, we will gladly take a moment to appreciate the asset class that accounts for the all important 40% of a classic 60/40 portfolio of US stocks and bonds; a portfolio which has returned a very impressive 12.6% in 2025.*  
     
Picture 1

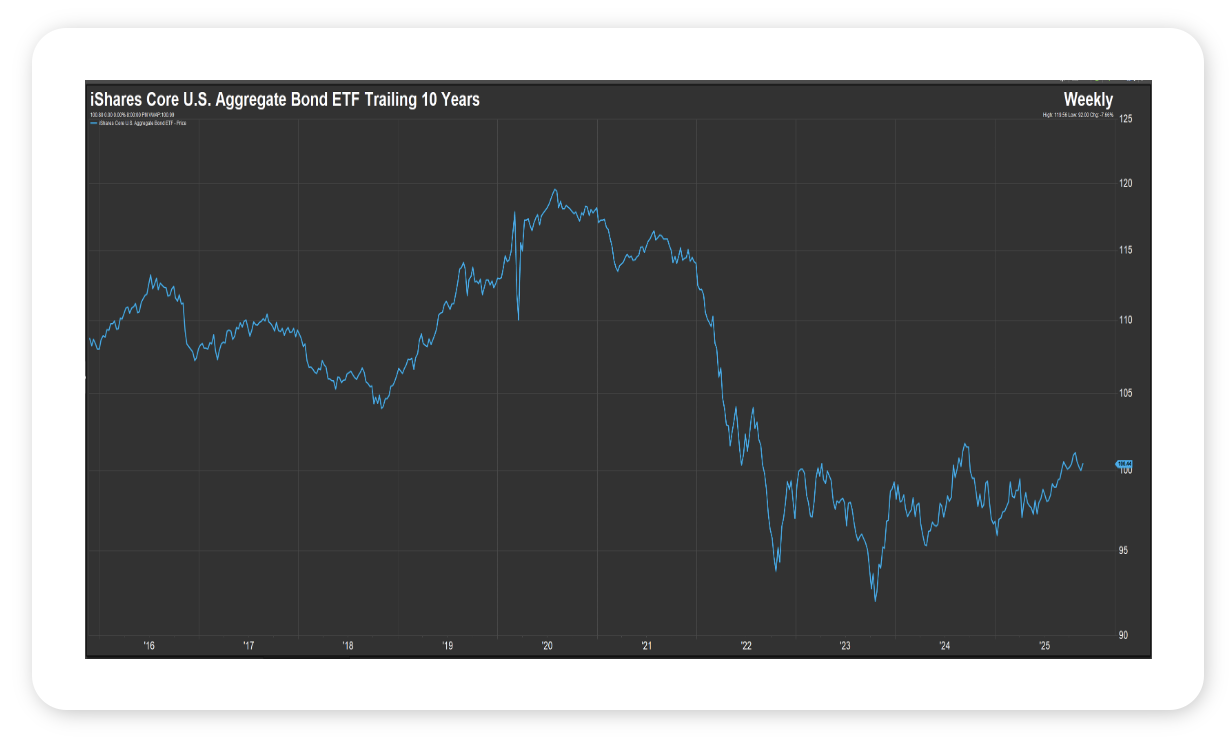
Source: FactSet, November 2025


Looking Back, Looking Ahead

By Ben Vaske, BFA, Manager, Investment Strategy

Last Week

Markets rebounded sharply during the short holiday week, reversing earlier November weakness and pushing the S&P 500 positive for the month. That marked seven straight months of gains. Momentum improved as odds of a December rate cut climbed.

Equities rallied across the board. The NASDAQ led with nearly a 5% gain, and small caps rose more than 4.5%. The S&P 500’s November strength pushed its year-to-date gain to roughly 18%, while international equities are up nearly 30%. Rising expectations for rate cuts pulled interest rates lower, giving fixed income a boost, though mortgage rates ticked slightly higher.

Key data last week showed steady producer prices, softer retail sales, and solid durable goods orders. PPI matched expectations with a 0.3 percent rise. Retail sales missed consensus but still grew at the fastest quarterly pace since 2023. Durable goods orders beat expectations and showed healthy year-over-year growth.

Earnings season has mostly wrapped up. For Q3 2025, S&P 500 earnings rose 13.4%, marking a fourth straight quarter of double-digit growth. Most companies reported positive earnings and revenue surprises. Retail and tech companies continued to report into the end of the season.
 

This Week

With the government having cancelled October’s nonfarm payrolls report due to the shutdown, markets will look to the ADP Employment report for direction on labor. Investors will also watch PMI data for signs of slowing.

The Federal Reserve’s preferred inflation measure, PCE, will be released Friday and will be a key input ahead of the next FOMC meeting. Consumer sentiment also gets a preliminary release on Friday and remains a closely watched gauge in a choppy year. 

We hope you have a great week. If there’s anything we can do to help you, please feel free to reach out to ben.vaske@orion.com or opsresearch@orion.com.
 

Get Your Own Market Commentary

Client-Friendly Weekly Wire

Want a version of Weekly Wire you can send directly to your clients? Subscribe to our Weekly Wire newsletter and get a client-friendly version every Monday. Simply download, add your firm's logo, and use with your clients!


Key Data

Stocks, Bonds, Alternatives, and Real Assets as of November 28, 2025

Security Name

Risk Score

1 Wk

1 Mo

QTD

YTD

1 Yr

3 Yr Ann.

Global Equities (60% US, 40% Intl)

100

3.57%

-0.54%

2.33%

22.18%

19.67%

19.60%

S&P 500 Total Return

102

3.74%

0.25%

2.59%

17.81%

15.00%

20.57%

Dow Jones Industrial Average

97

3.20%

0.48%

3.08%

13.88%

8.03%

13.42%

NASDAQ 100 Total Return

122

4.94%

-1.57%

3.16%

21.84%

22.40%

29.37%

TV Benchmark

107

3.96%

-0.28%

2.95%

17.84%

15.14%

21.12%

Morningstar US Large Cap

102

3.89%

-0.05%

3.04%

19.81%

18.08%

23.20%

Morningstar US Mid Cap

113

3.49%

0.64%

0.04%

10.17%

2.75%

11.84%

Morningstar US Small Cap

125

4.57%

2.48%

2.73%

11.77%

3.17%

11.90%

Morningstar US Value

98

2.92%

3.06%

3.12%

16.07%

8.47%

12.43%

Morningstar US Growth

126

4.53%

-2.37%

-0.98%

14.73%

10.08%

21.87%

MSCI ACWI Ex USA

98

3.18%

-0.01%

2.03%

29.21%

26.74%

16.51%

MSCI EAFE

101

3.26%

0.64%

1.84%

28.03%

25.14%

16.71%

MSCI EM

98

2.49%

-2.38%

1.71%

30.41%

30.29%

15.30%

Bloomberg US Agg Bond Index

27

0.38%

0.62%

1.25%

7.46%

5.70%

4.56%

Bloomberg High Yield Corp Bond Index

41

0.80%

0.58%

0.74%

8.01%

7.55%

9.63%

Bloomberg Commodity Index

70

2.76%

3.20%

6.19%

16.15%

17.33%

3.21%

Wilshire Liquid Alternative Index

25

0.96%

0.55%

1.11%

6.86%

4.30%

5.38%

MSCI US REIT

104

1.85%

2.26%

0.67%

5.42%

-2.37%

7.35%

US Dollar

10

-0.56%

0.82%

1.86%

-8.20%

-6.12%

-2.04%

Bloomberg US Treasury Bill 1-3mo

1

0.07%

0.30%

0.66%

3.93%

4.34%

4.92%

Source: Morningstar

The TV Benchmark represents an average of the S&P 500, Dow Jones IA, and NASDAQ 100 return indexes. The Orion Risk Score represents risk relative to the global equity market.


Interest Rates as of November 28, 2025

Rate

This Week

1 Wk Δ%

13-Wk Treasury Yield

3.70%

-0.04%

10-Yr Treasury Yield

4.02%

-0.05%

Bloomberg US Agg Yield

4.29%

-0.03%

Avg Money Mkt Yield

3.76%

0.00%

Avg 30-Yr Mortgage Rate

6.33%

0.05%

Sources: Yahoo Finance, S&P Global, Crane Data, BankRate


Key Economic Data Last Week

Data Point

Expectation

Actual

September U.S. Retail Sales

0.3%

0.2%

September Producer Price Index (PPI) YoY

--

2.7%

Core PPI YoY

--

2.9%

September Durable Goods Orders

0.5%

0.5%

Source: MarketWatch


Key Economic Data This Week

Data Point

Expectation

Release Date

ISM Manufacturing PMI

--

12/1/25

ADP Employment

--

12/3/25

ISM Services PMI

--

12/3/25

U.S. Trade Deficit

--

12/3/25

Personal Consumption Expenditures (PCE) YoY

--

12/5/25

Core PCE YoY

--

12/5/25

Source: MarketWatch

 
More Just for You

Want Resources for Your Clients?

Get a version of Weekly Wire you can send directly to your clients. Subscribe to our Weekly Wire newsletter and get a client-friendly version every Monday. Simply download, add your firm's logo, and use with your clients!

The views expressed herein are exclusively those of Orion Portfolio Solutions, LLC d/b/a Brinker Capital Investments, a registered Investment Advisor, and are not meant as investment advice and are subject to change. Information contained herein is derived from sources we believe to be reliable, however, we do not represent that this information is complete or accurate and it should not be relied upon as such. This information is prepared for general information only. It does not have regard to the specific investment objectives, financial situation, and the particular needs of any specific person.

An index is an unmanaged group of assets considered to be representative of a select segment or segments of the market in general, as determined by the index manager for the purposes of managing a specific index. You cannot invest directly in an index.

The CFA® is a globally respected, graduate-level investment credential established in 1962 and awarded by CFA Institute — the largest global association of investment professionals. To learn more about the CFA charter, visit www.cfainstitute.org.

Think2perform’s Behavioral Financial Advice program integrates traditional finance practices with psychology and neuroscience to improve emotional competency and decision-making behavior that increases effective usage of the financial plan with clients. To obtain the Behavioral Financial Advisor (BFA) designation, participants must complete a self-directed course, which takes 20-30 hours to complete, and includes a mix of interactive exercises, videos and case studies. To learn more about the BFA, visit https://www.think2perform.com.

Wealth management services provided by Orion Portfolio Solutions, LLC (“OPS”), a registered investment advisor. Orion OCIO services provided by TownSquare Capital, LLC (“TSC”), a registered investment advisors. OPS and TSC are affiliates and wholly owned subsidiaries of Orion Advisor Solutions, Inc.

*60/40 portfolio performance for 2025 based on S&P 500 Index (U.S. equity) and Bloomberg U.S. Aggregate Bond Index (U.S. fixed income). Illustrative only; excludes fees and taxes. Past performance is not indicative of future results.