





















Our investment team is closely monitoring the developments in the Middle East and the impact they are having on commodity prices, the stock market, and the world economy. We lament the loss of innocent life, pray for the safety of U.S. troops in harm’s way and mourn the U.S. military servicemembers who have lost their lives.
You will continue to hear from us on the conflict with Iran. In the meantime, if you have any questions on the markets and the economy or if there is anything we can do to support you and your clients during this difficult time, please reach out to us via our Investment Strategy Team’s email address at opsresearch@orion.com.
Weekly Notes from Tim
By Tim Holland, CFA, Chief Investment Officer
- Now, the headline assumes the reader is familiar with Madonna, at one point in time the biggest pop star in the world, and her hit song “Material World” – which Google just reminded me came out in 1984, which I remember listening to on the radio, which makes me feel, well, old(ish). But I digress, as the point of this week’s note is the relative world we live in when it comes to investing (while I do acknowledge any number of folks feel that we are living in a material world).
- We see every investing decision as a relative decision, meaning we decide to invest in something instead of something else, say stocks relative to bonds; domestic markets relative to international markets or actively managed funds relative to passively managed funds. Even the decision to stay in cash is a relative decision – we have decided to invest in dollars relative to…fill in the blank. Beyond the myriad decisions an investor must make when putting capital to work, there are myriad factors that drive those decisions, including investment objective, risk profile and valuation, and it is the topic of valuation, or to be more specific the topic of relative valuation, that brings us to the heart of this week’s note and the dataset we want to dig into.
- US equities have had a great run, with the S&P 500 producing average annual returns of 19% and 13% over the past three and five years (as of July 31st). Beyond producing strong absolute returns, US stocks have produced strong relative returns, outdistancing most other equity markets over those periods. That out performance pushed US equity valuations to multi-year if not multi-decade highs relative to international equities, a valuation disparity that had many investors, not surprisingly, a bit concerned about the outlook for US stocks and a bit optimistic about the outlook for international stocks (and as we know, ex-US markets have posted strong returns the past 18 months or so). Well, as international stocks rallied and Wall Street raised earnings estimates for US equities, the valuation premium US stocks have enjoyed has compressed to its lowest level in six years – all the while US stocks didn’t miss a beat, a reminder we don’t live in a zero-sum world (see chart). The S&P 500 still commands a valuation premium to ex-US stocks, which is justified, we think, by historically high profitability and superior earnings growth.
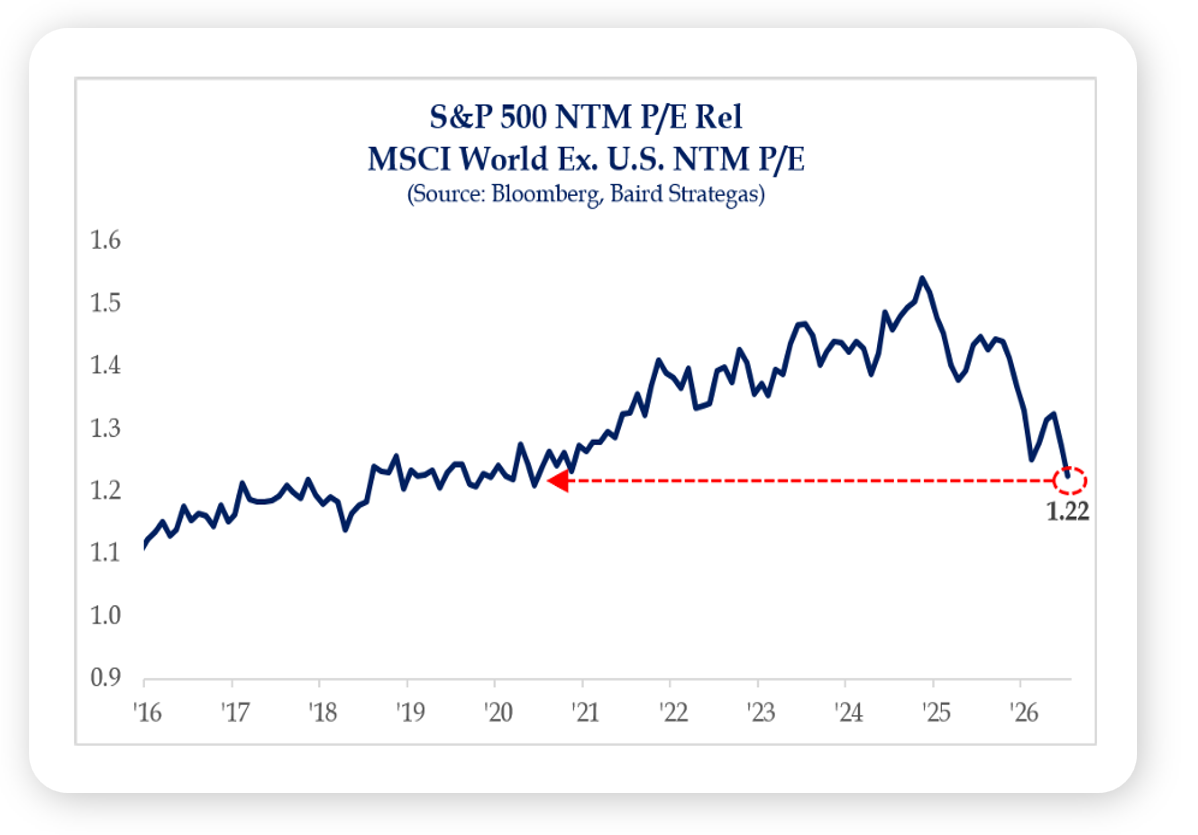
Source: Strategas, July 2026
Looking Back, Looking Ahead
By Ben Vaske, CFA, Manager, Investment Strategy
Last Week
It was a modestly positive but notably mixed week for markets. The S&P 500 gained just under half a percent and the NASDAQ 100 added just over 1%, while the Dow slipped slightly negative. The broadening rotation that has defined the third quarter continued, with mid caps gaining nearly 1.5%, small caps just over 1%, and value outperforming growth by a meaningful margin. Emerging markets and commodities were the week's standouts, each adding nearly 3%, both benefiting from this quarter’s weaker U.S. dollar. The quarter-to-date picture reinforces the rotation theme: value is up over 7%, mid caps and developed international each nearly 5%, while the NASDAQ 100 remains slightly negative on the quarter despite its strong year-to-date performance.
Year-over-year, CPI stands at 3.4% and PPI at 4.7%, still well above target but no longer surprising to the upside, which has pushed the probability of a September rate hike down to 33%. Retail sales were the week's negative surprise, falling 0.6% against expectations of a 0.1% gain, the largest monthly decline in over a year. The weakness was concentrated in autos and non-store retailers, the latter likely distorted by Amazon shifting its Prime Day event to June this year from July last year. A 30-year Treasury auction produced the highest yield since 2001 at 5.216%, a data point that carries implications well beyond the bond market, touching mortgage rates, equity discount rates, and the cost of servicing a national debt that has grown by $3.6 trillion over just the past year.
This Week
The FOMC minutes from the July meeting will be released this week and are likely to draw more attention than usual, as Warsh has dramatically shortened public commentary and removed forward guidance from policy statements, making the minutes one of the few remaining windows into the committee's thinking ahead of the September 16th meeting.
The economic calendar is otherwise light, and on the earnings front, consumer names dominate the week's releases with Alibaba among the notable reporters. With 88% of Q2 results in and blended earnings growth tracking at 50.4%, the bulk of earnings season is now behind us.