




















Key takeaways:
- Higher bond yields have opened up income opportunities in the fixed income market not seen in decades.
- Some investors are in danger of missing these opportunities because they’re focusing on past bond performance and sometimes opting for cash-like instruments.
- With yields historically being the long-term driver of total returns for bonds, higher starting yields have typically signaled higher future bond returns.
- Using bond strategies that employ seasoned and disciplined risk management may help address downside concerns about fixed income.
Bonds are offering some of their best income opportunities in decades after this year’s surge in yields. Yet the bond market’s lackluster performance in the last five years has led clients to question the need for bond allocations.
The rearview mirror is useful for checking where you’ve been. It’s a terrible way to decide where you’re going. In fixed income, recency bias may be one of the most expensive habits an investor can have.
Last Five Years Were a Math Problem
Consider what the Bloomberg U.S. Aggregate Bond Index has delivered recently. From January 1, 2021 through Sept. 30, 2026, the Agg returned -4.66% cumulatively or -0.83% annualized. Along the way, it fell more than 18% at its low point.
This performance was largely set before it began.
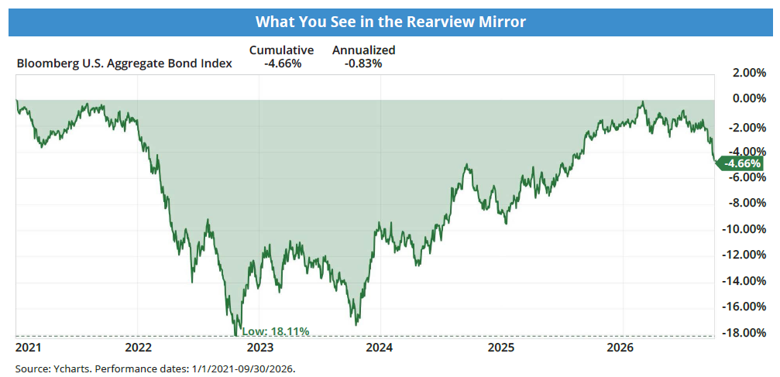
At the end of 2020, the Agg yielded just 1.12% with a duration of 6.31 years. That is thin income paired with plenty of rate sensitivity. When rates rose, there was almost no yield to cushion the price decline. The outcome was simple bond math.
Here’s the important part: That vulnerable starting yield no longer exists.
Starting Yield Is the Best Map We Have
As of Sept. 30, 2026, the Agg yielded 5.56% with a duration of 5.8 years. That’s more than four times the income of 2020 with less interest rate sensitivity.
Why does that matter?
According to J.P. Morgan’s Guide to the Markets, starting yield has explained 89% of the variation in the Agg’s subsequent five-year annualized returns, measured monthly since 1976.
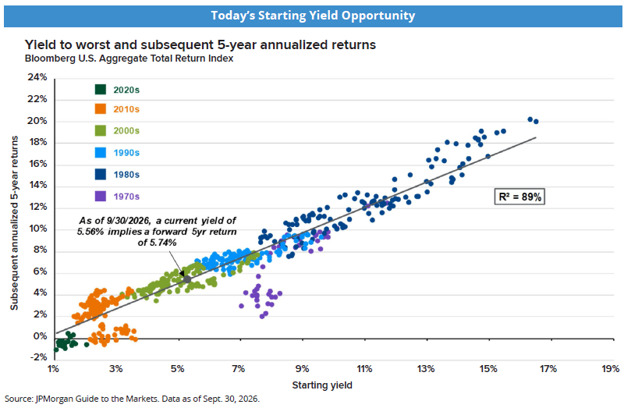
Few relationships in investing are as consistent as starting yields and future bond performance. The 2020s cluster sat near the bottom of that chart because investors started with yields near 1%. Today’s starting point is higher by multiples.
Still, past performance is no guarantee of future results, and this relationship is no exception. But it does suggest that judging bonds by the past five years is like judging a garden by how it looked in the winter when it’s now summer.
The broader industry appears to be taking notice. Vanguard’s recent commentary1 has echoed JP Morgan’s, stating this year’s spike in bond yields has “set the table” for strong bond income and overall bond returns, while also citing stretched valuations for U.S. equities.
Income Does the Heavy Lifting
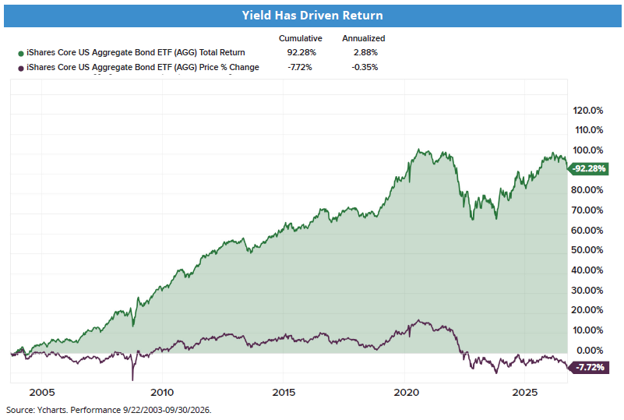
If you want proof that yield matters, look at the iShares Core U.S. Aggregate Bond ETF (AGG) over its full history. From September 22, 2003 through September 30, 2026, AGG’s cumulative total return was 92.28%. Its price change over the same period was -7.72%.
Read that again. Over more than two decades, positive return was driven by income while price was the drag. For investors driving toward their retirement goals, coupons aren’t the gears. They’re the engines.
If Yield Matters, Why Stop at the Agg?
Here’s a question worth asking: if income drives bond returns, why limit a portfolio to a benchmark built mostly from lower-yielding sectors? As of September 30, 2026, the Agg was about 47% U.S. Treasuries, 22% investment-grade corporate bonds, and 24% agency mortgage-backed securities.
Meanwhile, much of the fixed income universe sits outside it. Representative ETFs in bank loans, high-yield corporates, preferreds, and emerging market debt were showing SEC yields roughly between 6.2% and 6.8% as of mid-2026. Each of those sectors carries its own risks, including credit, currency, and liquidity risk, so higher yield is never free. But an allocation restricted to sectors in the Agg may leave meaningful opportunity on the table.
The Road Ahead Isn’t Pothole-Free
Optimism about yields shouldn’t mean ignoring the hazards. Two stand out.
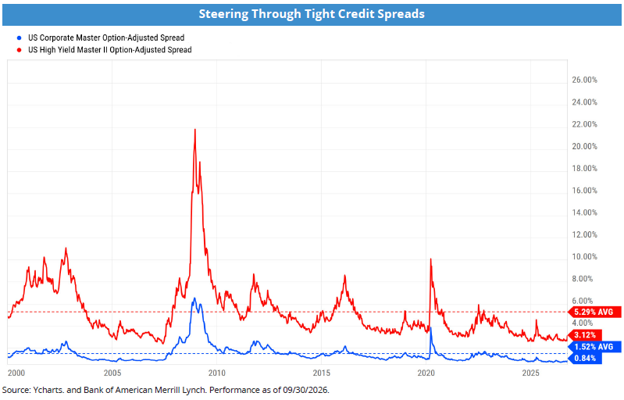
Credit spreads are tight. As of September 30, 2026, high-yield option-adjusted spreads were 3.12%, well below their long-term average of 5.29% since 2000. Investment-grade spreads were 0.84% against a 1.52% average. Investors are being paid less than usual to take credit risk, which means less cushion if conditions deteriorate.
The rate path keeps moving. Between June and September, the FOMC’s median projections for the Fed Funds rate moved higher: from 3.8% to 4.1% for 2026, from 3.6% to 4.1% for 2027, and from 3.4% to 3.9% for 2028. Expectations can shift quickly, and duration exposure deserves active attention.2
A Disciplined Framework: When to Buy, What to Buy, When to Sell
This is where investment process matters.
At Ocean Park, we approach fixed income through three disciplines.
- A rules-based, repeatable process, driven by price trends. It dictates when to buy and sell.
- A tactical pursuit of upside.
- The objective to limit drawdowns with a proprietary Trailing Stop Discipline.3
Rules-based, disciplined risk management, not emotion or guesswork, define our buy and sell signals. Because we seek upside with a focus on limiting drawdowns, we believe our process lends itself to today’s yield-driven bond market, which can be vulnerable to price downside.
Eyes Forward
The past five years were shaped by a starting yield that no longer exists. Today’s environment offers more income with less duration as well as a broad menu of opportunities. However, there are real risks that call for disciplined risk management. The rearview mirror has its place. Just don’t let it do the steering.
To discuss how Ocean Park Advisor Consulting can help, contact Bill Phillips at Bill.Phillips@oceanparkam.com or (310) 912-0787, or visit www.oceanparkam.com.