

















Key takeaways:

  • Private credit investing has exploded in growth, with the private credit market valued
    north of $1.6 trillion.
  • There are signs of risks emerging that could bear some similarity to the early warnings that we saw with subprime in 2007.
  • The valuation methods for private credit holdings and other factors may obscure risks.
  • Investor focus on artificial intelligence may be distracting from the private credit risk at hand, including its potential knock-on effects on the broader market.

In March 2007, then Federal Reserve Chairman Ben Bernanke told Congress that the problems emerging in subprime mortgages seemed “likely to be contained.” He was describing a corner of the credit markets that most investors had never examined closely, one that had grown quickly and quietly. Nineteen years later, a different corner of the credit markets is generating its own “containment assurance.” The International Monetary Fund said in April that turmoil at private credit managers including Blue Owl, Ares and Blackstone appears limited, with the potential for a “contained systemic impact.” The similarity was potentially ominous, if not unavoidable.


Shadow Banking

Private credit is direct lending outside the banking system. The asset class took shape after the 2008 financial crisis, when new capital rules made it expensive for banks to hold risky corporate loans, and investment funds stepped in to lend directly to mid-sized companies. The pitch to borrowers was speed and flexibility. The proposition to investors was yield, often at a premium to public market corporate credit, in exchange for illiquidity. The Office of Financial Research now puts U.S. private credit commitments above $1.6 trillion, larger than the domestic broadly syndicated loan and high yield markets.

For most of its life, private credit has been an institutional product. That changed with the rise of the non-traded business development company (BDC), a vehicle that packaged private loans into an evergreen fund with monthly purchases and quarterly redemptions that are typically capped at 5% of net asset value. These structures brought this asset class to a much broader retail audience, touting double-digit yields in a semi-liquid format. Wealth platforms embraced them and the non-listed BDC market crossed $200 billion in aggregate NAV late last year. The structure worked well as long as money moved in one direction.


Rushing for the Exits

That direction began to reverse last fall. The bankruptcies of subprime auto lender Tricolor and auto parts maker First Brands prompted JPMorgan CEO Jamie Dimon to warn that looser underwriting, opaque ratings and illiquid vehicles could echo the subprime meltdown. Then, in early 2026, a new source of investor anxiety emerged. Software companies feature prominently in many private credit portfolios, and concerns about AI disruption of software-as-a-service business models raised questions about credit quality in loans underwritten.

Private credit purveyors added their own fuel to the fire. Blue Owl announced plans in November to merge its unlisted BDC, OBDC II, into its listed BDC at net asset value, and the market response was swift. Blue Owl’s stock dropped nearly 11% over eight trading days before the firm canceled the deal. Weeks later, BlackRock TCP Capital disclosed write-downs that cut its NAV by 19% in the fourth quarter. In February, Blue Owl closed quarterly redemptions on OBDC II altogether and sold $1.4 billion in loan assets to raise cash.

According to investment banking advisory firm, Robert A. Stanger & Company, publicly registered non-listed BDCs met about $6.9 billion of redemption requests in the first quarter while more than $6 billion in requests went unmet, with gross sales 59% below a year ago at $4.9 billion. For the first time in the sector’s history, more capital left non-listed BDCs in a quarter than came in.
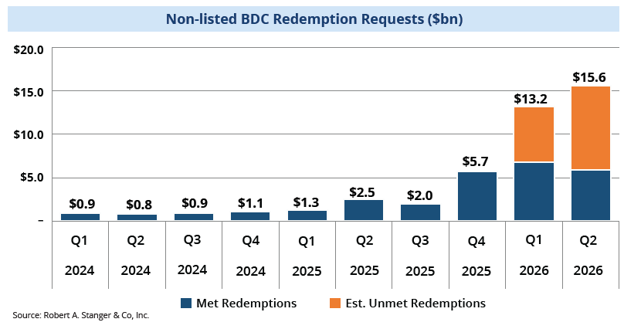
 

Chart: Non-Listed BDC Redemption Requests


The second quarter brought another $5.9 billion in redemptions met, lifting the year-to-date total to nearly $13 billion. Requests kept running well past the caps at the largest funds. Apollo Debt Solutions disclosed second-quarter demand of 16.8% of shares against the 5% it honored, and Morgan Stanley’s North Haven fund prorated requests at 43 cents on the dollar. The pressure is not uniform. Oaktree’s fund saw demand ease below its cap and Goldman’s vehicle fulfilled every request. Managers argue the gates are functioning exactly as designed, which is little consolation for investors seeking a return of their capital.


Price Discovery

The wave of redemptions is shining a light on a known issue with the asset class. Private loans do not trade, so their values are estimates. Managers set marks quarterly with input from valuation agents hired by those same managers. The potential for conflict of interests is clear. Higher marks mean higher fees, steadier performance and calmer investors.
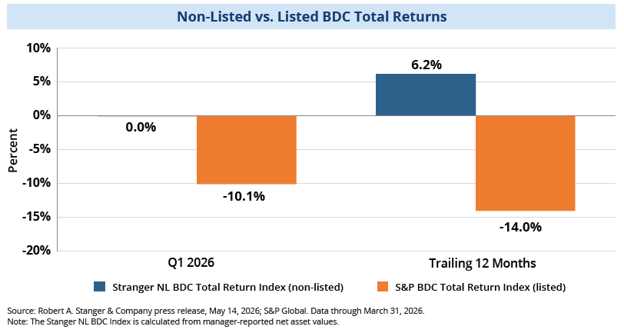
 

Chart: Non-Listed vs. Listed BDC Total Returns


The public market has been offering a second opinion. Stanger’s index of non-listed BDCs was essentially flat in the first quarter at -0.03%, while the S&P BDC index of listed funds fell -10.1% in the quarter and -14% over the trailing year. Both sets of listed and non-listed BDCs hold broadly similar loans to broadly similar companies. The gap between them is not a difference in exposure, but rather a difference in who sets the price.

Collateral Damage

The next question is who else might be standing in the blast radius. These funds enhance returns by using leverage. BDCs operate with roughly 1 to 1.2 times debt-to-equity on average, permitted under a 2018 statutory change that doubled the old limit. A fund meeting redemptions has three sources of cash, which are loan repayments, asset sales and borrowing against the portfolio. When loan repayments slow and the level of asset sales both risk crystallizing marks below NAV, the credit facility becomes the pressure valve. Leverage rises mechanically at exactly the moment portfolio quality is being questioned.
 

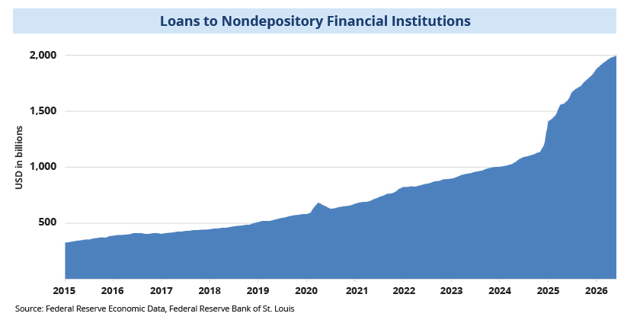
Chart: Loans to Nondepository Financial Institutions


Ironically, much of that borrowing comes from the banks that private credit disintermediated. The Office of Financial Research reports that large banks held $123 billion in committed exposures to private credit obligors as of year-end 2024, and cautions that reported borrowings by some funds may be understated.

Direct bank exposure to private credit is estimated near $300 billion, sitting inside nearly $2 trillion of rapidly growing bank exposure to nonbank financial institutions. These loans are senior and well collateralized, and no one expects them to default in isolation. The subprime lesson was never about the first-order exposure. It was about collateral assumptions that held right up until everyone needed them simultaneously.
 

Echoes of 2007

Let’s ask the question directly: Is this subprime again? The scale merits the comparison, since subprime mortgages totaled roughly $1.5 trillion on the eve of the crisis. So does the choreography of officials assuring everyone the damage is contained. However, the differences are equally noteworthy. Fund leverage of roughly one turn compares to 30 or 40 times in pre-crisis securitization structures, and there is no CDO-style daisy chain of comparable scale. Subprime sat atop a private debt buildup of 50 percentage points of GDP over a decade, whereas the U.S. private debt ratio has declined since 2021. Goldman Sachs estimates that even an adverse private credit scenario would shave only 0.2% to 0.5% from GDP. The bear case rests on what could trigger a broader credit cycle.

It is reasonable to assume that we are still in the early innings in a private credit default cycle. Because of the lack of mark-to-market pricing and ‘extend and pretend’ tactics, it may be some time before the true scope of the problem is revealed. It is important to remember that subprime delinquencies began climbing two full years before anyone used the word “crisis.”


Wisdom of the Crowds

The remarkable element of this episode is how little the broader market has reacted.

Credit spreads remain narrow, equity indices sit near highs and the commentary that once would have obsessed over gated funds is consumed instead by AI capex and the productivity debate. We made the case in our last commentary that artificial intelligence has displaced the Federal Reserve as the market’s center of gravity. It may have displaced credit risk from investor attention as well. That inattention could mean the problem is genuinely minor, or it could mean the market is distracted by a new shiny toy.

For now, we lean toward the former while not declaring an official all clear. Gates are more likely a feature rather than bug, operating as intended by managing a liquidity mismatch that is working itself out in an asset class facing its first real test. Under this scenario, it’s undoubtably painful for those in the queue but also not foreshadowing a broader systematic issue.

However, investors should always be wary of complacency. Bernanke was not wrong about the size of subprime lending in March 2007. He was wrong about what it was connected to. In today’s highly interconnected global financial markets, one can never be certain of the potential knock-on impacts from one segment to another.

Access Ocean Park's
Model Lineup on Orion

Expand your offering and unlock new opportunities with direct access to Ocean Park's model lineup, integrated seamlessly into Orion platforms.

Learn More

ABOUT THE AUTHOR

James St Aubin

James St. Aubin, CFA®, CAIA®, is Chief Investment Officer for Ocean Park Asset Management. He has oversight of all Investment Management department activities, in collaboration with Co-founders David Wright and Kenneth Sleeper. An experienced investment management executive, his career of more than 20 years includes leadership roles in asset allocation, manager research and portfolio construction. James earned a Bachelor of Science in Finance from DePaul University and is a CFA® and CAIA® Charterholder.


RISKS AND DISCLOSURES:

This blog is sponsored by Ocean Park Asset Management. Orion Advisor Solutions, Inc. (“Orion”) or its affiliates and subsidiaries received compensation from Ocean Park Asset Management for the placement of this advertisement content. Ocean Park Asset Management and Orion are not affiliated companies, and the advertisement is not a recommendation or endorsement by Orion for any of the services referenced or provided.

This website may contain links to third-party websites. Any links to such third-party websites are provided solely as a convenience to you and not as an endorsement by Orion of the content on such third-party websites, or any affiliation or association with its operators. Orion is not responsible for the content of linked third-party websites, including, without limitation, any link contained in a linked website, or any changes or updates to a linked website, and do not make any representations regarding the information, services, products or accuracy of any material contained on such third-party websites.

This material does not constitute any representation as to the suitability or opportunities of any security, financial product or instrument. There is no guarantee that investment in any program or strategy discussed herein will be profitable or will not incur loss. This information is prepared for general information only. Individual client accounts may vary. It does not have regard to specific investment objectives, financial situation, and the particular needs of any specific person who may receive this report (information). Investors should seek financial advice regarding the appropriateness of investing in any security or investment strategy discussed and should understand that statements regarding future prospects may not be realized. Investors should note that security values may fluctuate, and that each security’s price or value may rise or fall. Accordingly, investors may receive back less than originally invested. Past performance is not a guide to future performance. Investing in any security involves certain non-diversifiable risks including, but not limited to, market risk, interest-rate risk, inflation risk, and event risk. These risks are in addition to any specific, or diversifiable, risk associated with particular investment styles or strategies.

Wealth management services provided by Orion Portfolio Solutions, LLC (“OPS”), a registered investment advisor. Orion OCIO services provided by TownSquare Capital, LLC (“TSC”), a registered investment advisor. OPS and TSC are affiliates and wholly owned subsidiaries of Orion Advisor Solutions, Inc.

Information presented herein with respect to any third-party service provider has been provided by those third-party service providers and has been reproduced here with their permission. Such information does not necessarily reflect the views and opinions of Orion Advisor Solutions, Inc. (“Orion”) or its affiliated companies. Orion does not endorse any particular third-party product or service. Our clients should undertake their own assessments to determine whether these parties meet their business and due diligence requirements. Ocean Park Asset Management and Orion Portfolio Solutions, LLC (“OPS”) are not affiliated companies, and the blog is not a recommendation or endorsement by OPS for any of the services referenced or provided. While some OPS solutions may contain one or more of the specific strategies mentioned, OPS is not making any comment as to the suitability of these, or any investment product for use in any portfolio.

These materials may not be copied, altered, or redistributed without the prior written consent of Ocean Park Asset Management, LLC. This information is for educational purposes and is not intended to provide, and should not be relied upon for accounting, legal, tax, insurance, or investment advice. This does not constitute an offer to provide any services nor a solicitation to purchase securities. The contents are not intended to be advice tailored to any particular person or situation.

Unless otherwise noted or sourced within, the statements herein are the opinion of the author. The statements have been made based on publicly available information and proprietary research but remain the opinion of the author unless noted otherwise. We do not guarantee the accuracy or completeness of the information provided in this document. All statements and expressions herein are subject to change without notice. Any projections, market/ economic outlooks or estimates herein are forward-looking statements based upon certain assumptions and should not be construed to be indicative of the actual events that will occur. Other events that were not taken into account may occur and may significantly affect the statements made herein. Except where otherwise indicated, the information and statements provided herein are based on matters as they exist as of the date of preparation and not as of any future date, and we are under no obligation to correct, update or revise the information in this document or to otherwise provide any additional materials.

Ocean Park Asset Management, LLC is a registered investment advisers (“RIA”) regulated by the U.S. Securities and Exchange Commission (“SEC”). The use of the term “registered” does not imply any particular level of skill or training and does not imply any approval by the SEC. For information pertaining to the registration status of Ocean Park Asset Management, LLC, please call 1-844-727-1813 or refer to the Investment Adviser Public Disclosure website (www.adviserinfo.sec.gov).

©2026 Ocean Park Asset Management. All rights reserved.