





















The mid-term elections are just under three months away, and markets have begun to price in the potential impacts of the vote. Races in the House of Representatives and the Senate will influence fiscal policy, alter the geopolitical landscape, and weigh on a wide array of economic and non-economic issues.
Ahead of the vote, I’ve assembled visuals covering 10 topics that should be top of mind for investors; and to help “set the stage” leading up to the mid-terms on November 3rd.
1) The Mid-terms Historically Punish the President’s Party
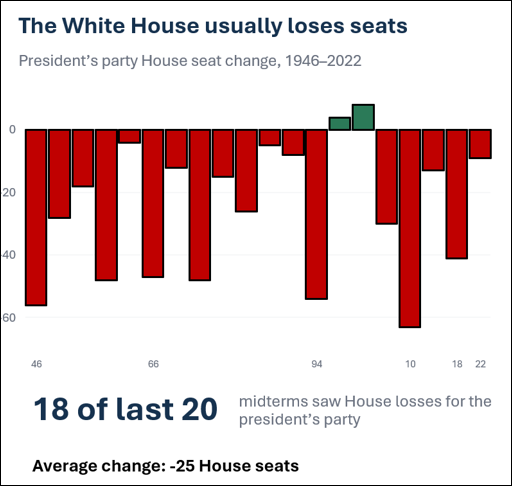
Source: US House of Representatives
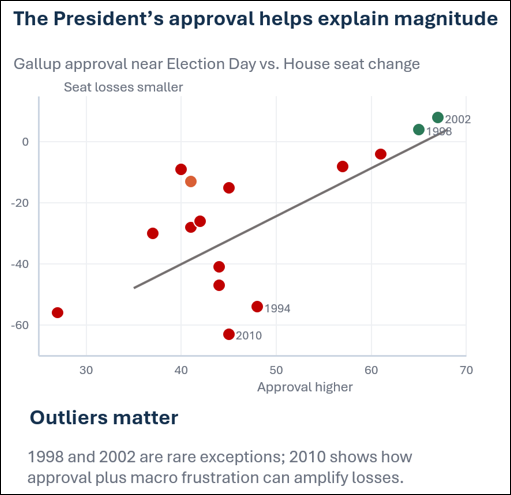
Source: Gallup
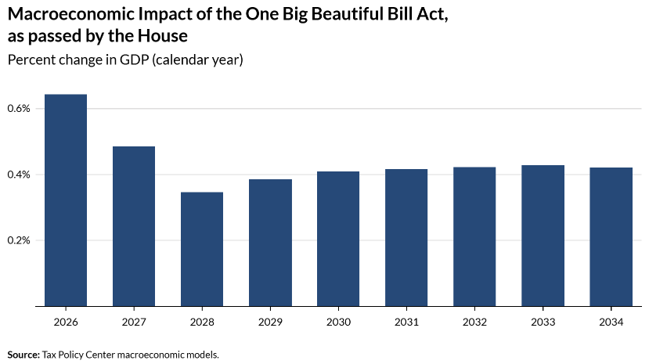
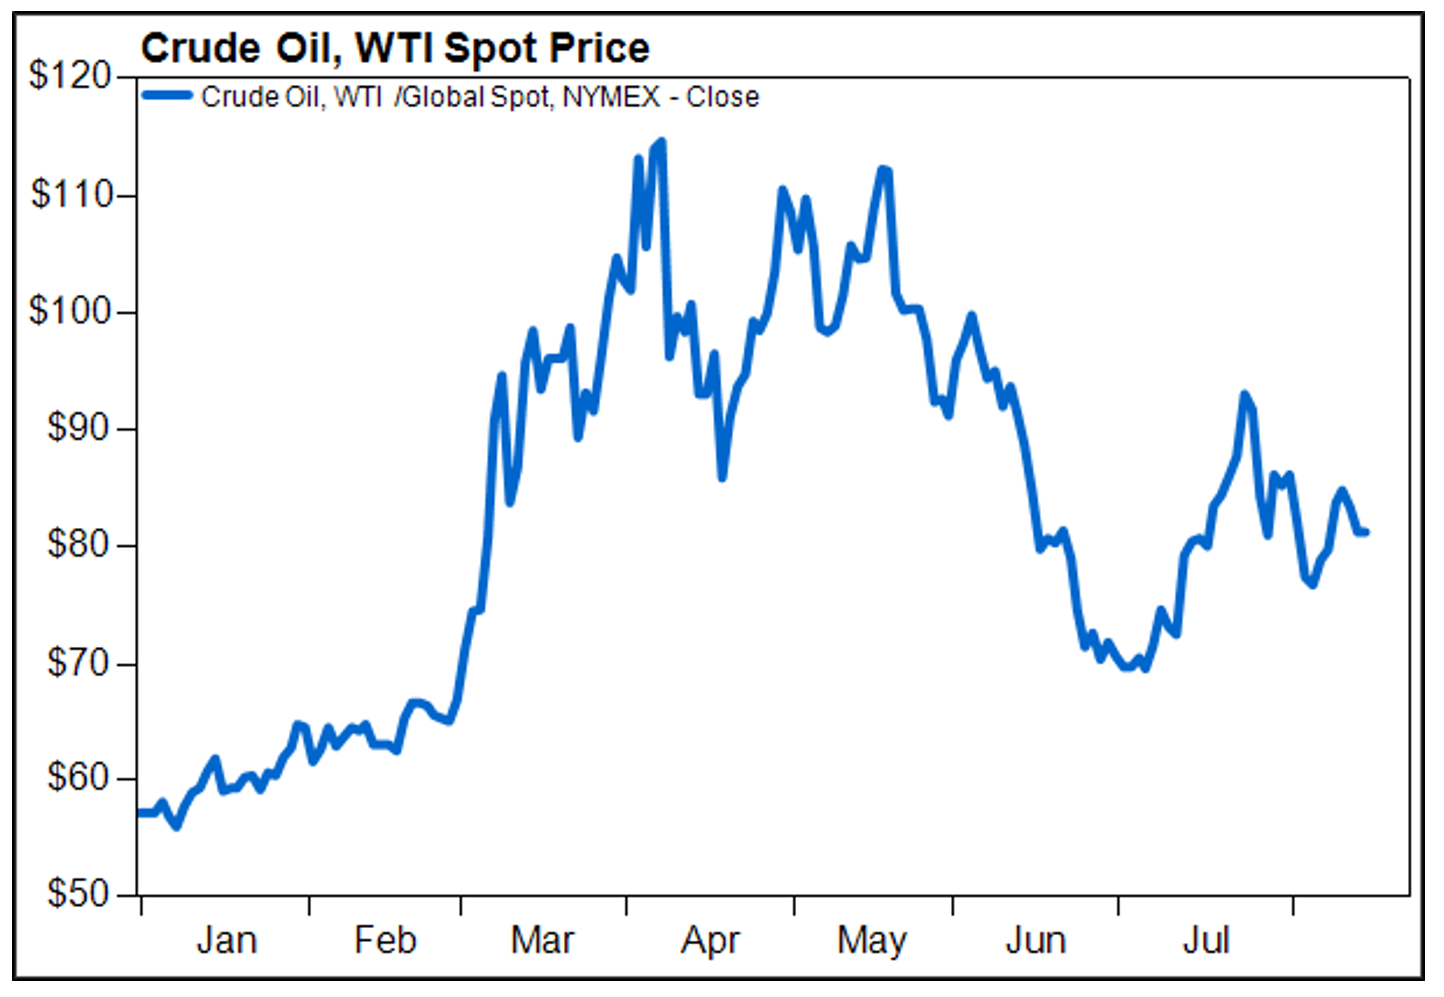
2) The One Big Beautiful Bill Act, Energy Market Disruptions, Inflation, AI Regulation, and Trade Policy Represent the Largest Economic Issues in Focus
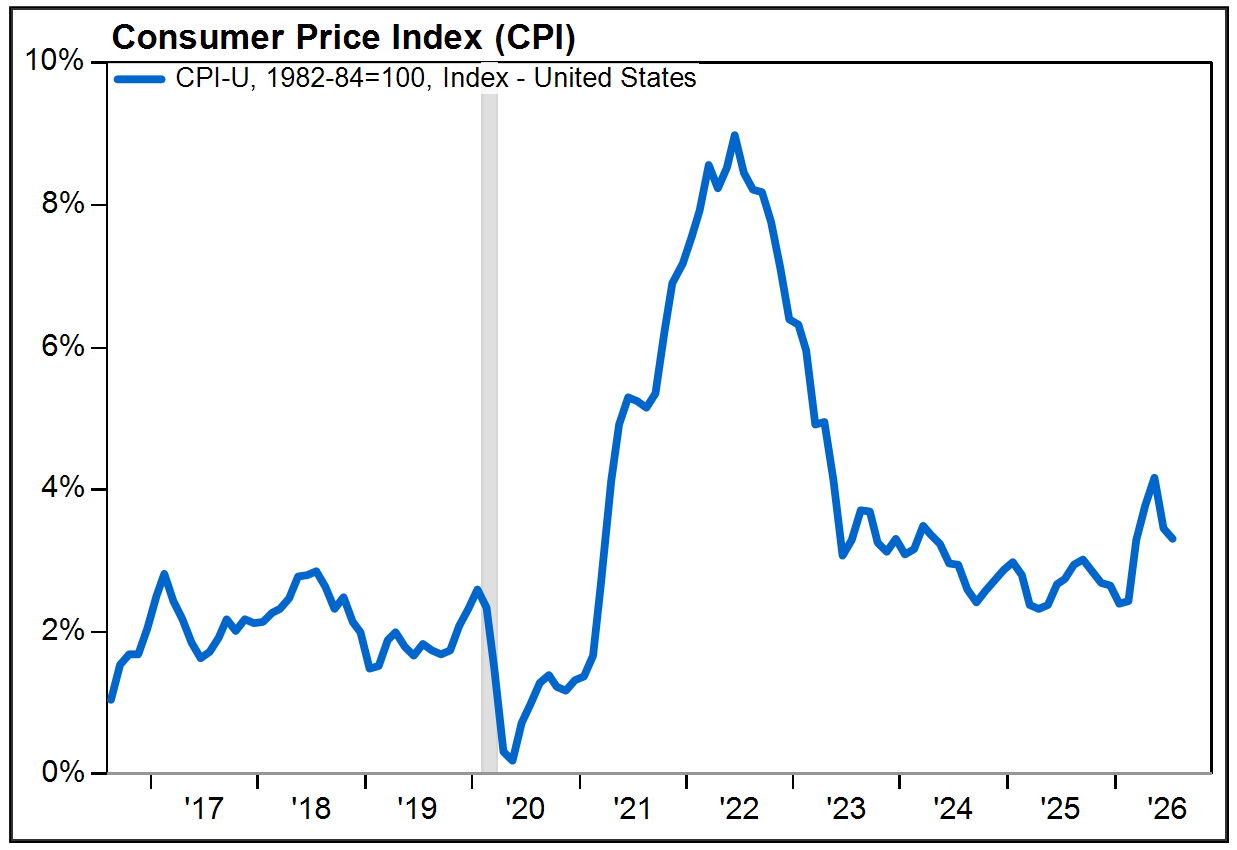
Gray bars denote U.S. recession periods.
Source: FactSet
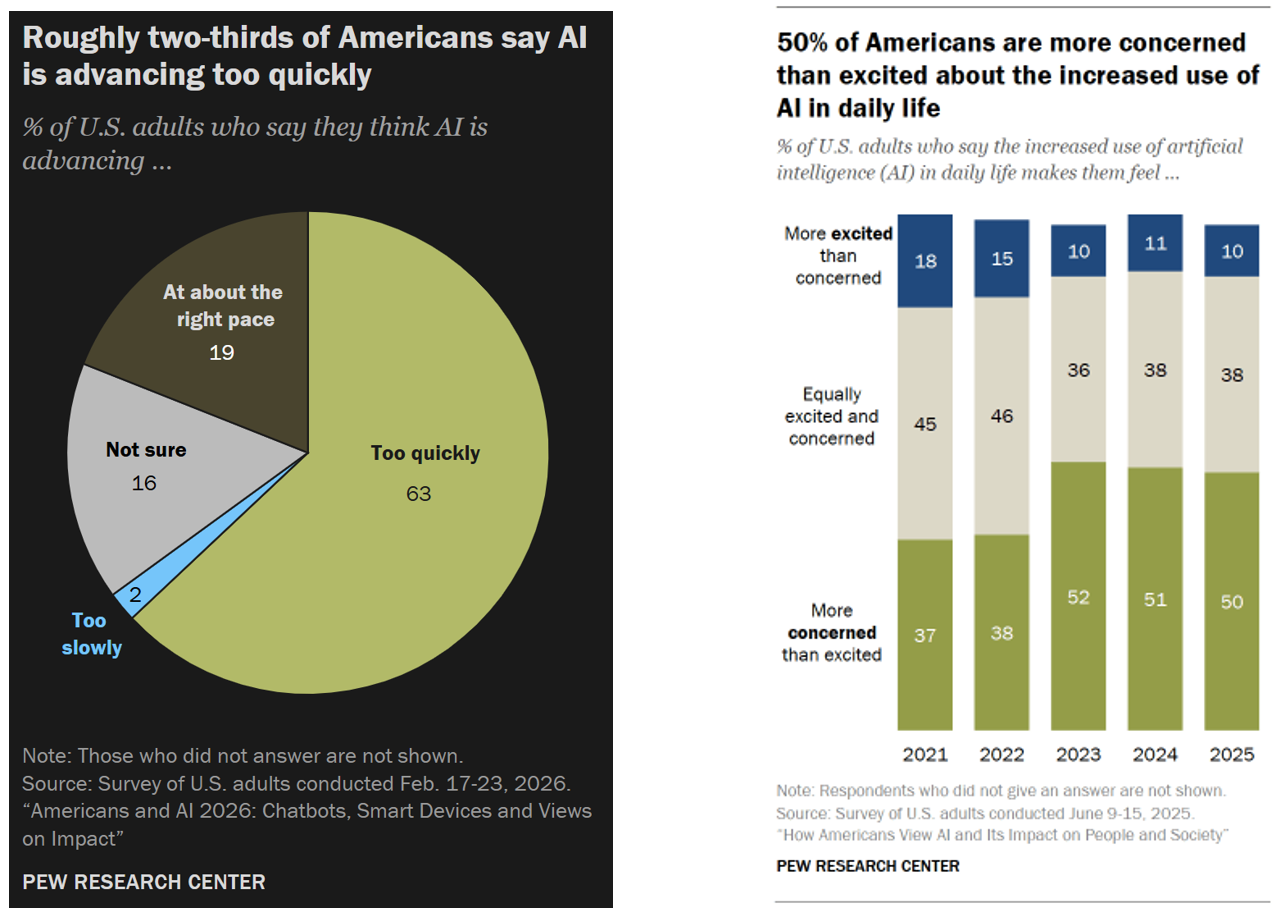
Source: Pew Research
3) As Things Stand Today, Republicans Hold a Razor Tight Margin in the House, and Comfortable Margin in the Senate
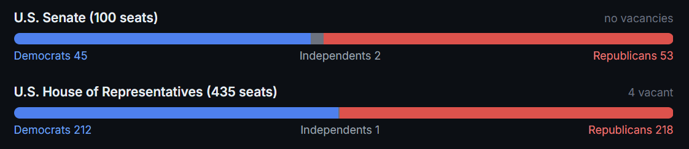
Source: Congress Countdown
4) What are the Polls Telling Us?
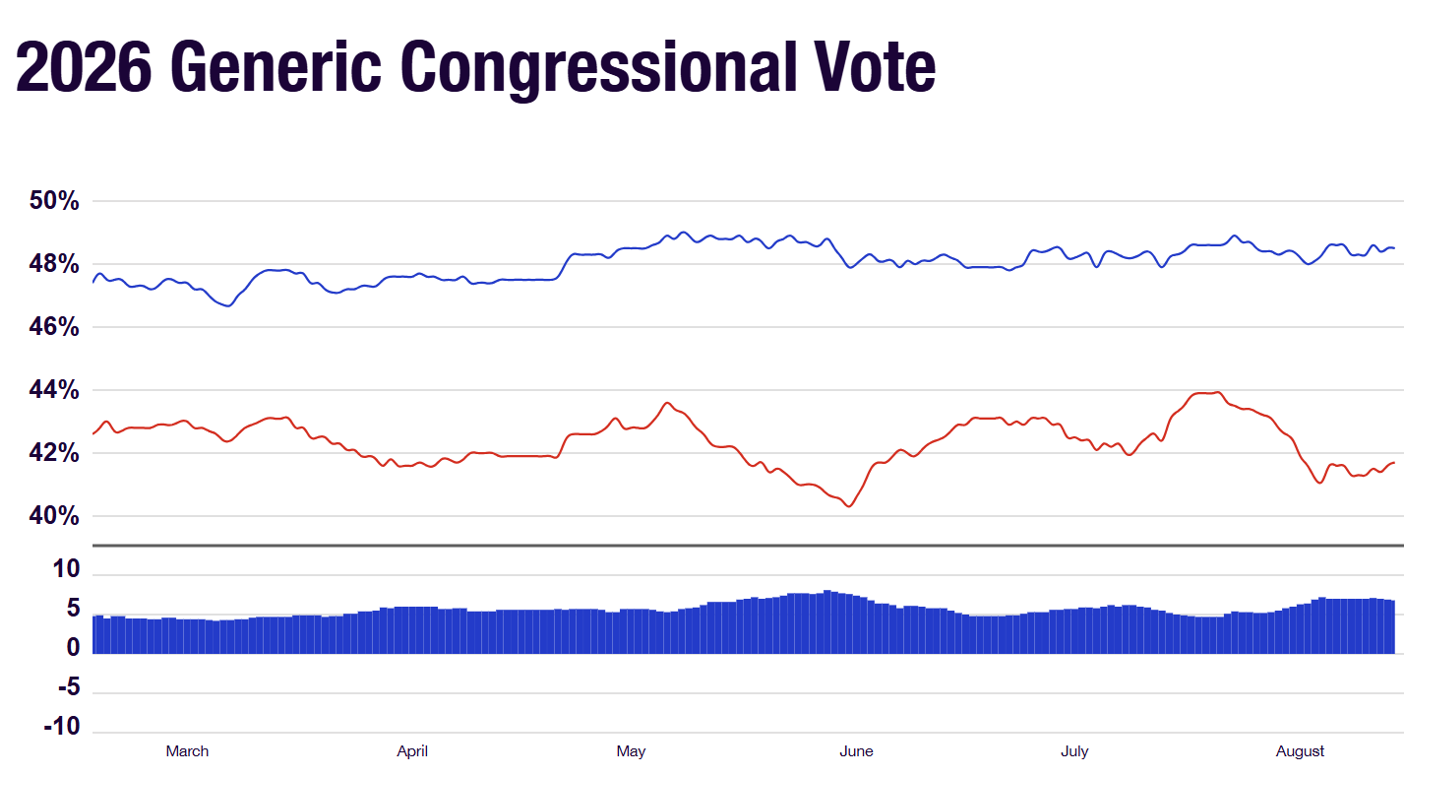
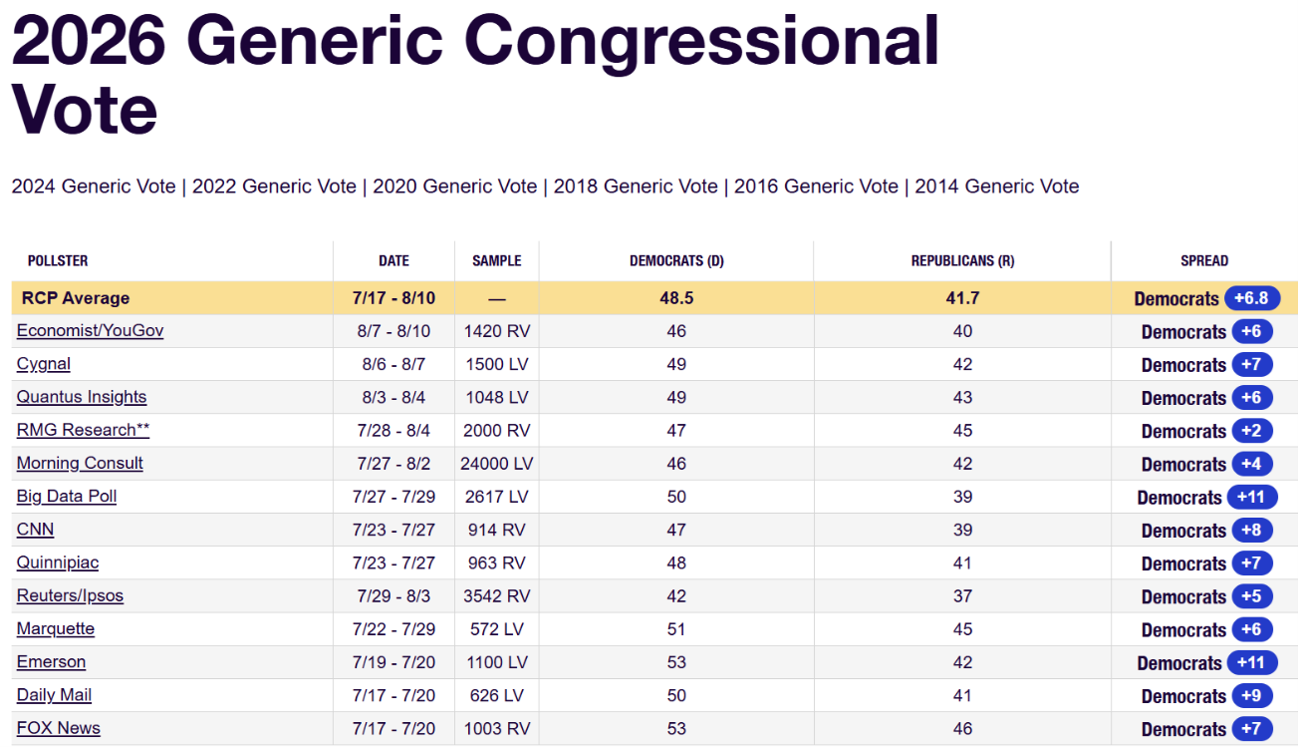
Source: RealClearPolitics
5) Prediction Markets Favor Republicans Maintaining Control of the Senate and Democrats Winning the House
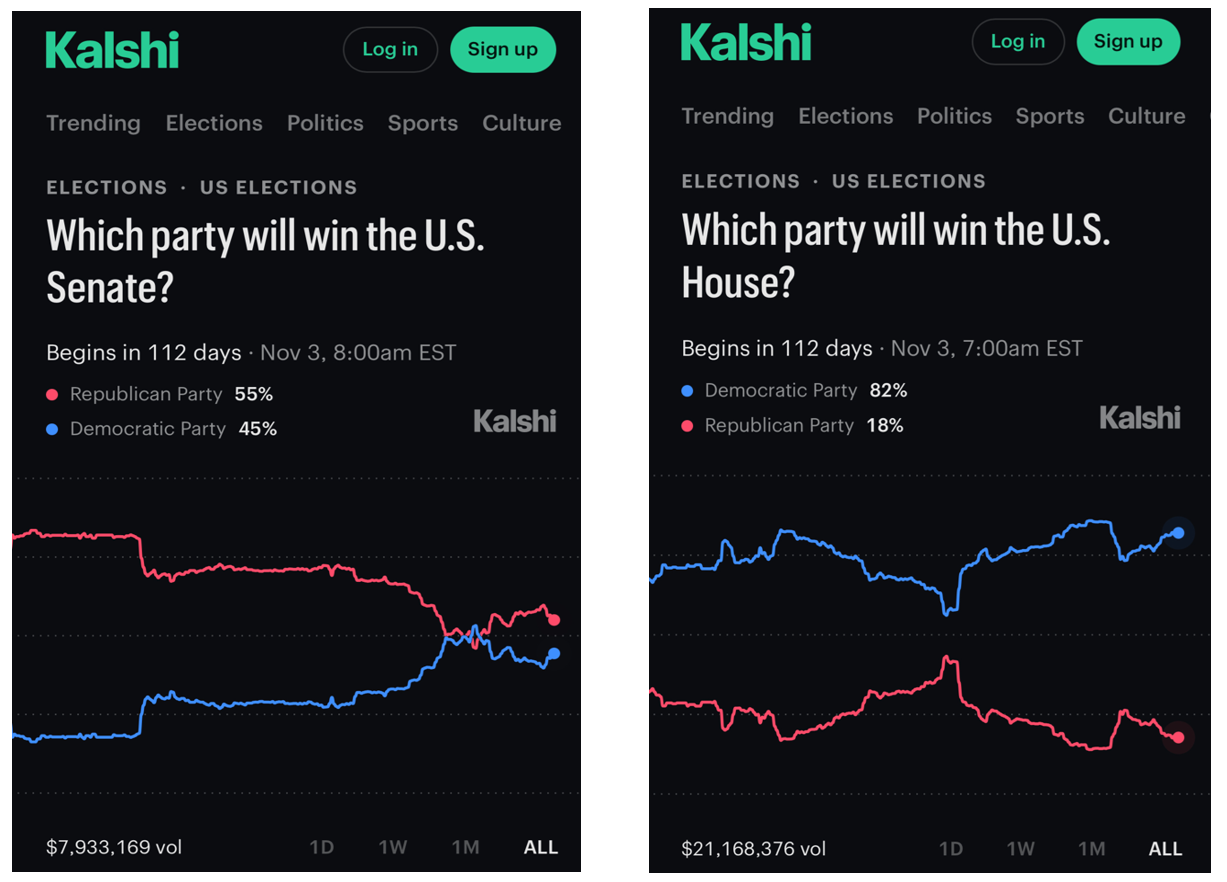
Source: Kalshi
6) Markets are Far Less Partisan; Volatility is Normal in Mid-term Years and Returns Tend to Improve After the Vote
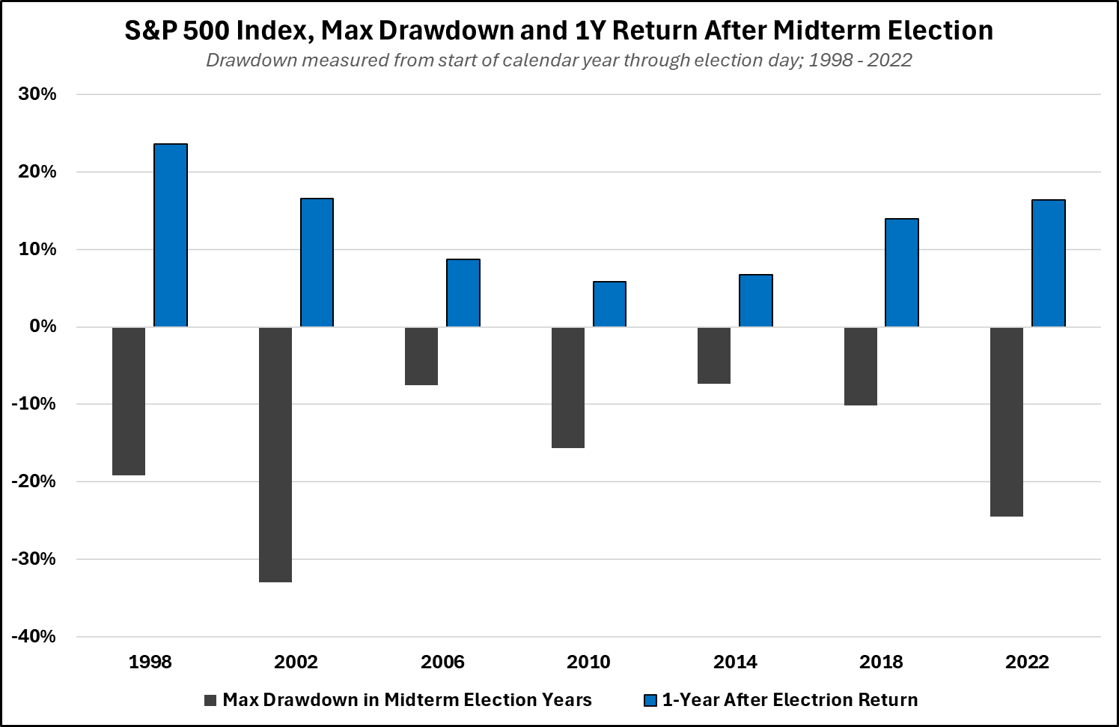
Average Max Drawdown: -17%
Average 1Y Return After the Vote: 13%
Source: FactSet; 1998 - 2022
7) If the Polls Hold… Stocks Could Land the Ideal Partisan Environment
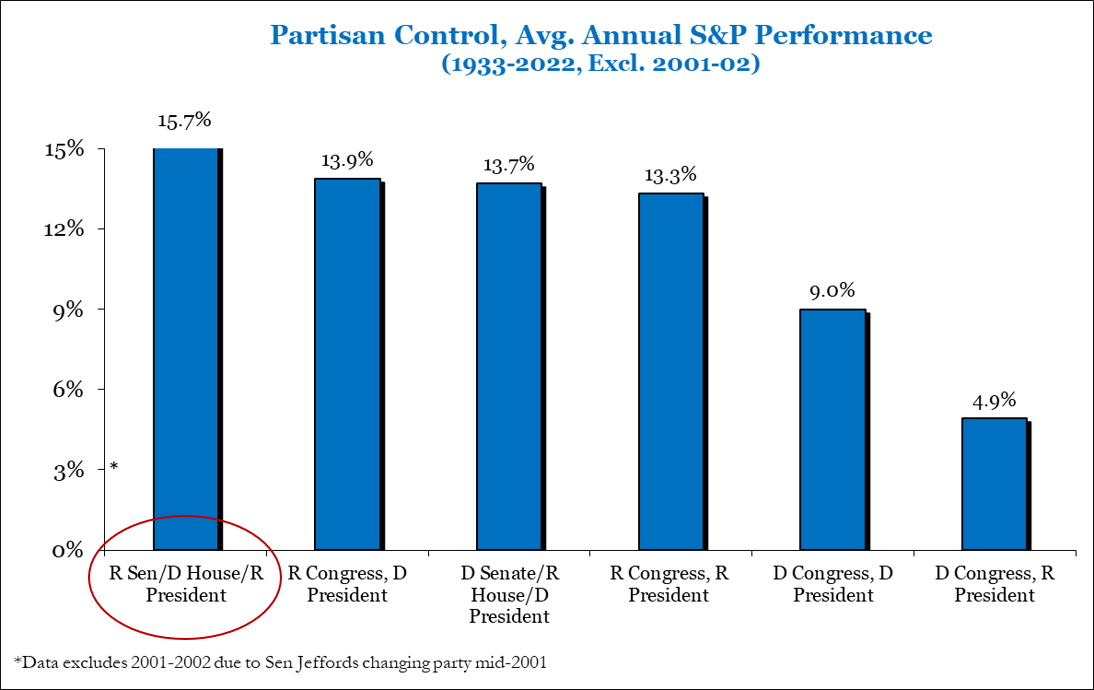
Source: Strategas
8) Three Months is an Eternity in Politics


Source: CNN, NY Times, Fox News, NPR
9) Our Debt and Deficit isn’t Going Away Anytime Soon
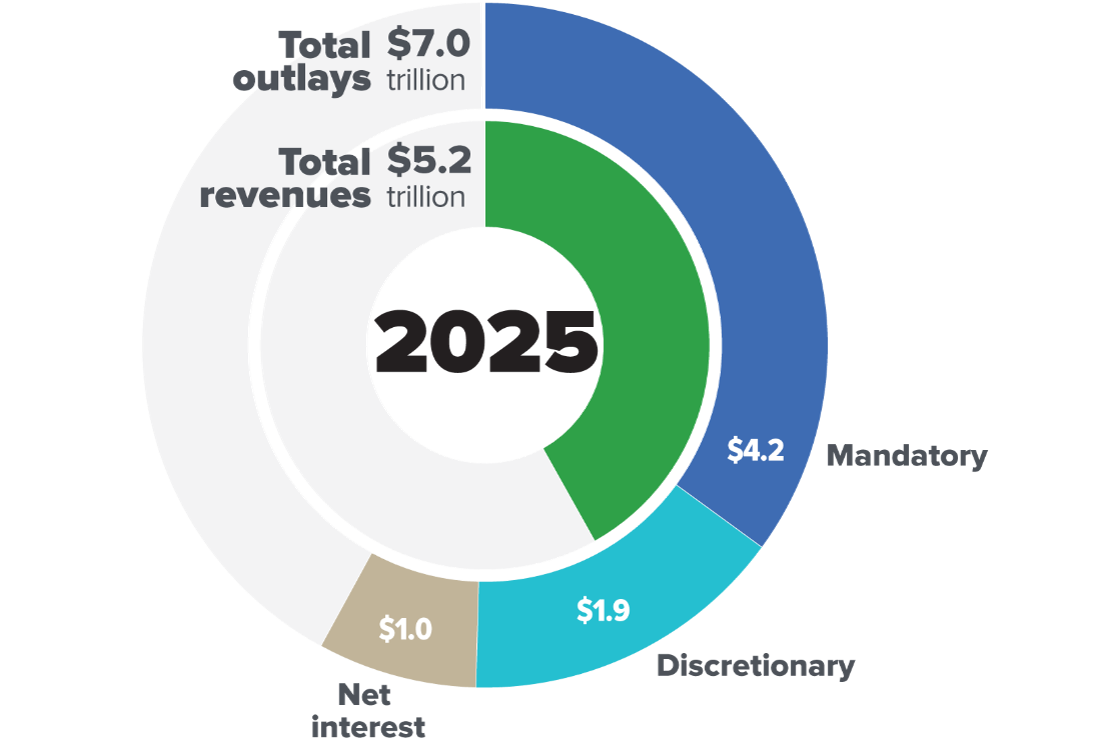
Source: Congressional Budget Office
10) Our Near-Term Outlook for the Economy and Risk Assets Does Not Include a Recession or Bear Market – Regardless of How Congress Looks in 2027
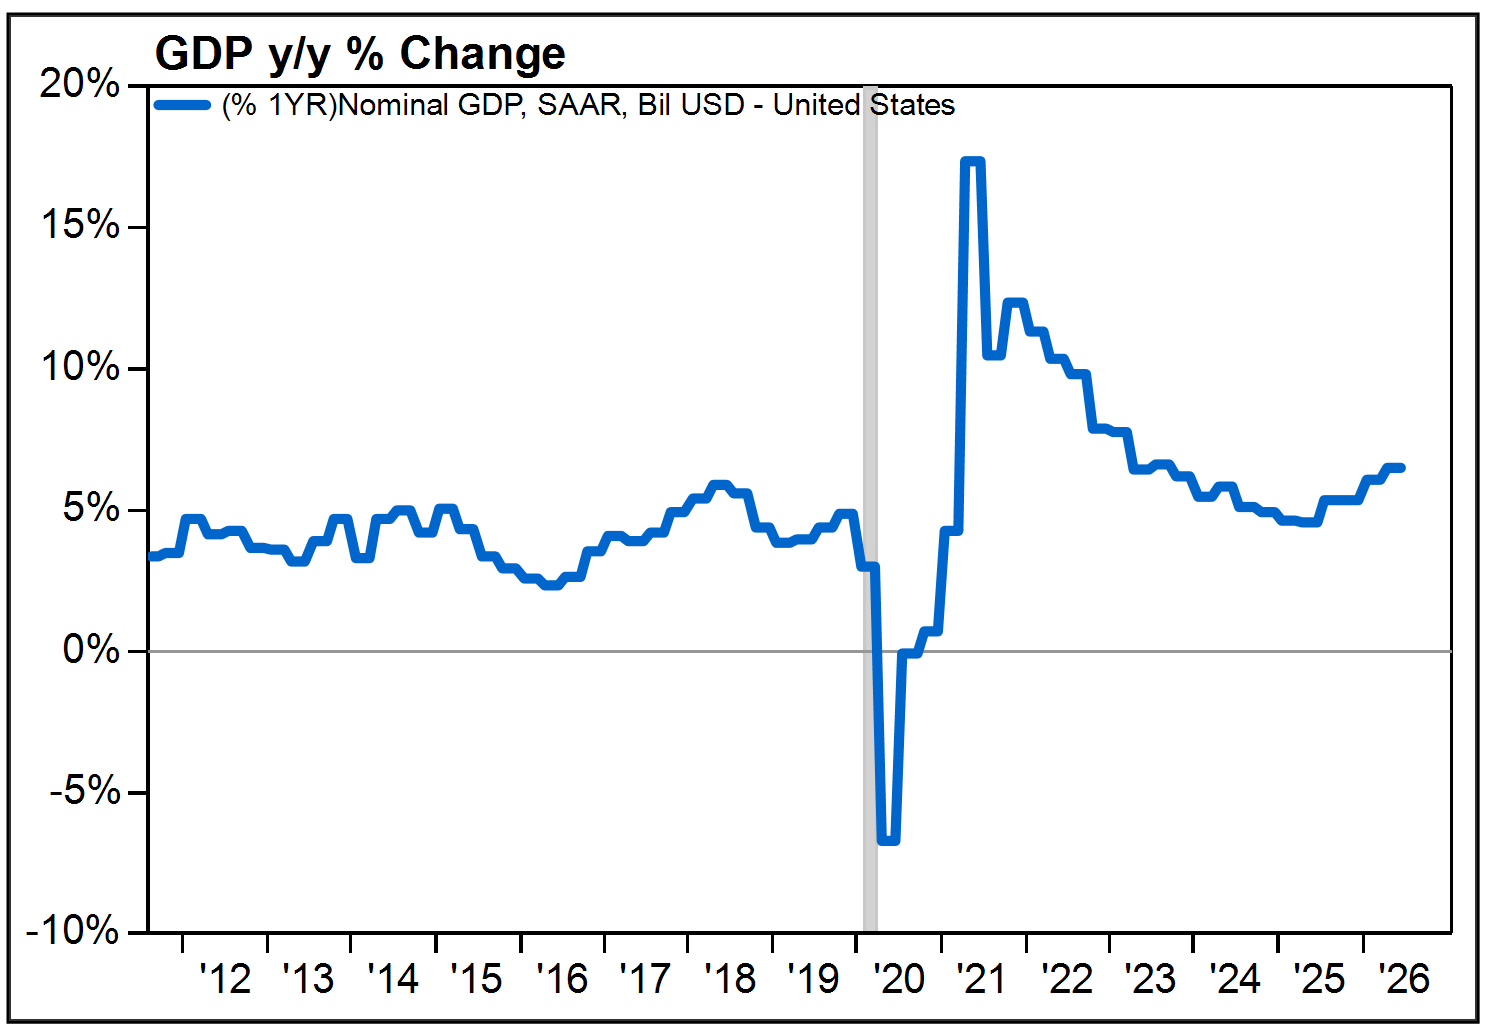
Gray bars denote U.S. recession periods.
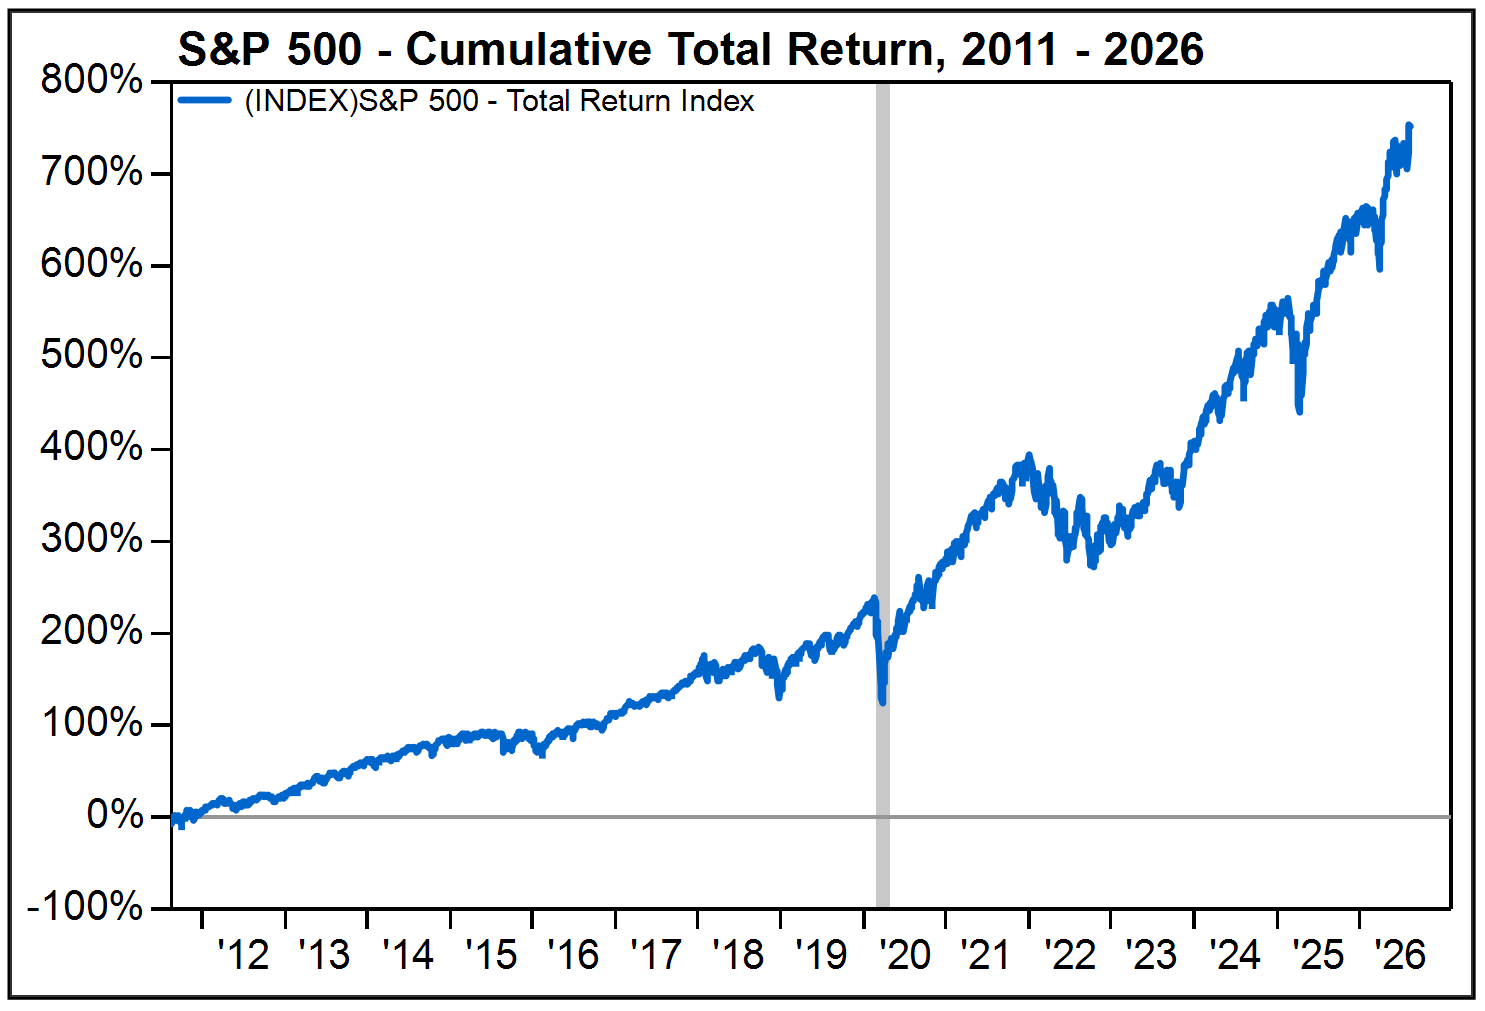
Gray bars denote U.S. recession periods.
Source: FactSet