


The equity market’s pullback in March served as a meaningful test of investor conviction. A combination of catalysts in March forced investors to re-assess risk, as geopolitical uncertainty, higher energy prices, and a difficult path ahead for interest rates sent stocks lower amidst stretched valuation levels. The drawdown was far from extreme, though importantly, it created some interesting valuation dislocations beneath the surface of jarring headlines.
Most equity segments have since notched fresh all-time highs during the recent April rally, making for an interesting time to assess how equities should be valued. The result today is a market that looks different depending on where one focuses: still expensive at the headline level, but more nuanced — and more debatable across styles, sectors, and market capitalizations.
S&P 500: Still Expensive but Far Less Extreme
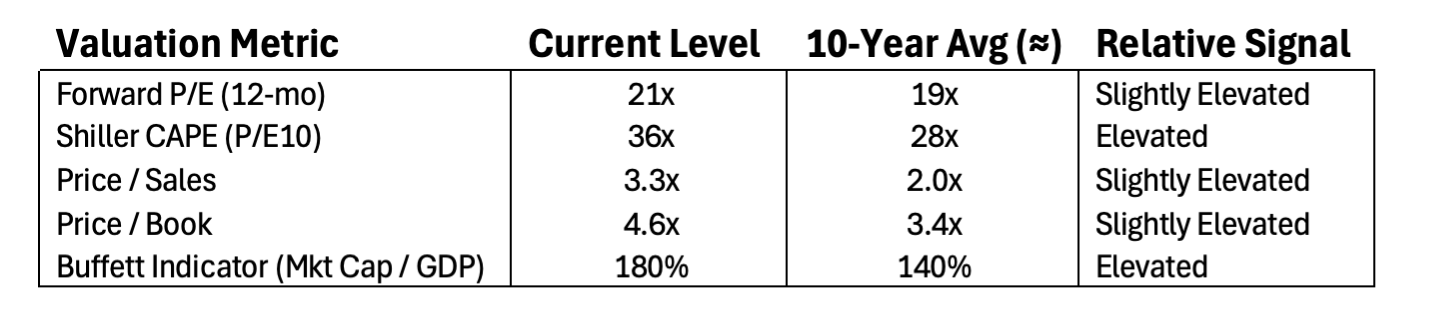
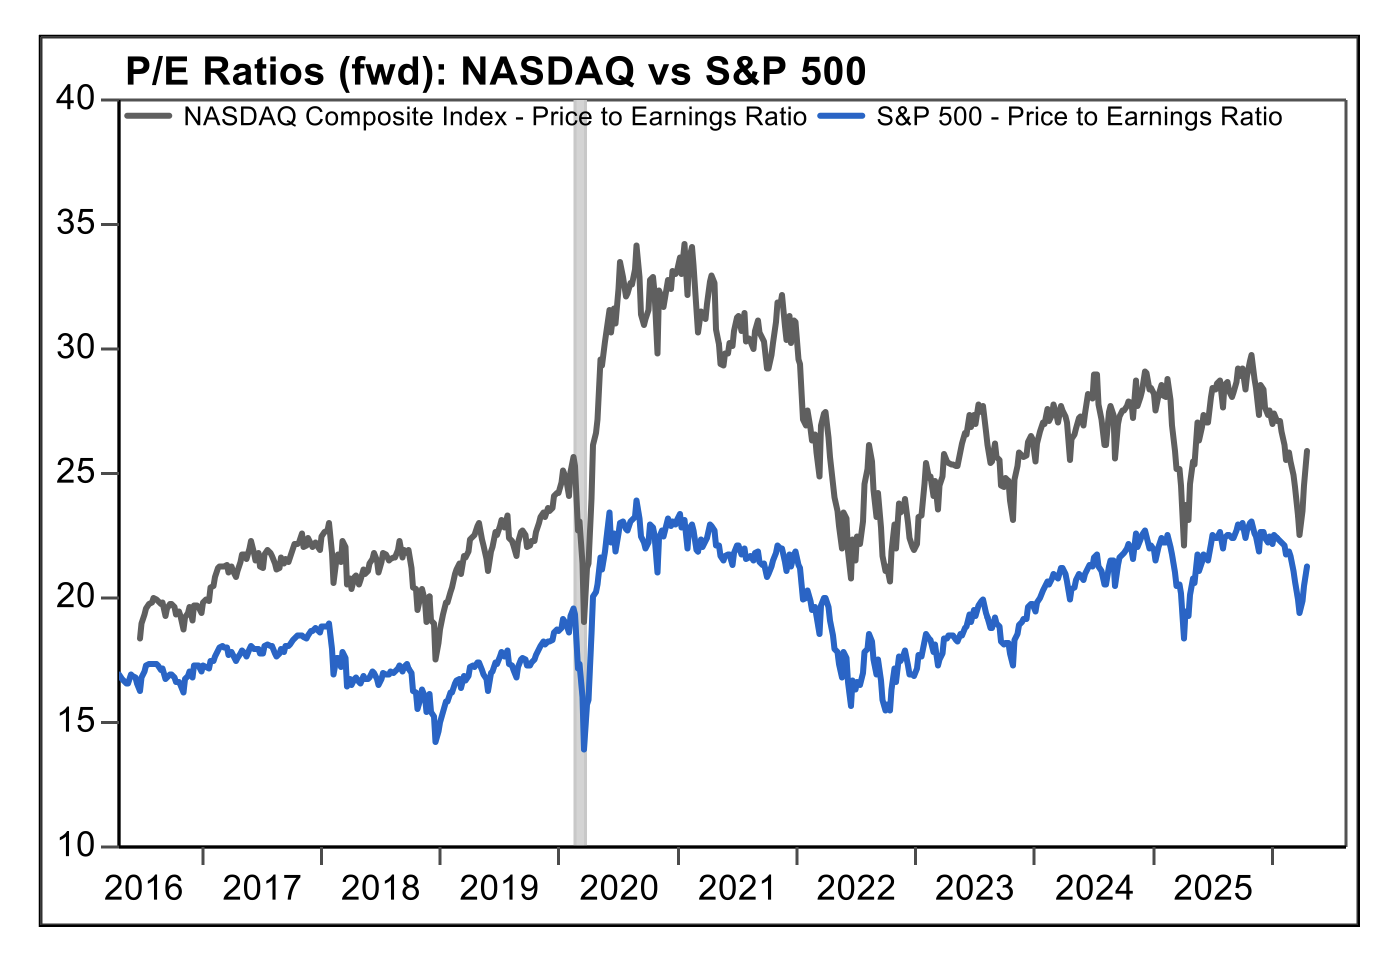
Even after the March pullback, the S&P 500 remains above its 5-year historical valuation averages, though the gap has narrowed. Following last week’s market rally (more on that in a bit), the forward P/E multiples sits just above 21x forward looking 12-month earnings estimates — which is not far off the roughly 19x average since 2016. The post-covid era encompassed volatile interest rate expectations, fiscal stimulus, elevated inflation, a resilient US consumer, and booming wealth creation.
Source: FactSet, as of 4/17/26
Source: FactSet, as of 4/17/26
Price to sales ratios remain near 3.3x, which is above the ~2.0x average of the last ten years, re-affirming multiple expansion since the pandemic era.
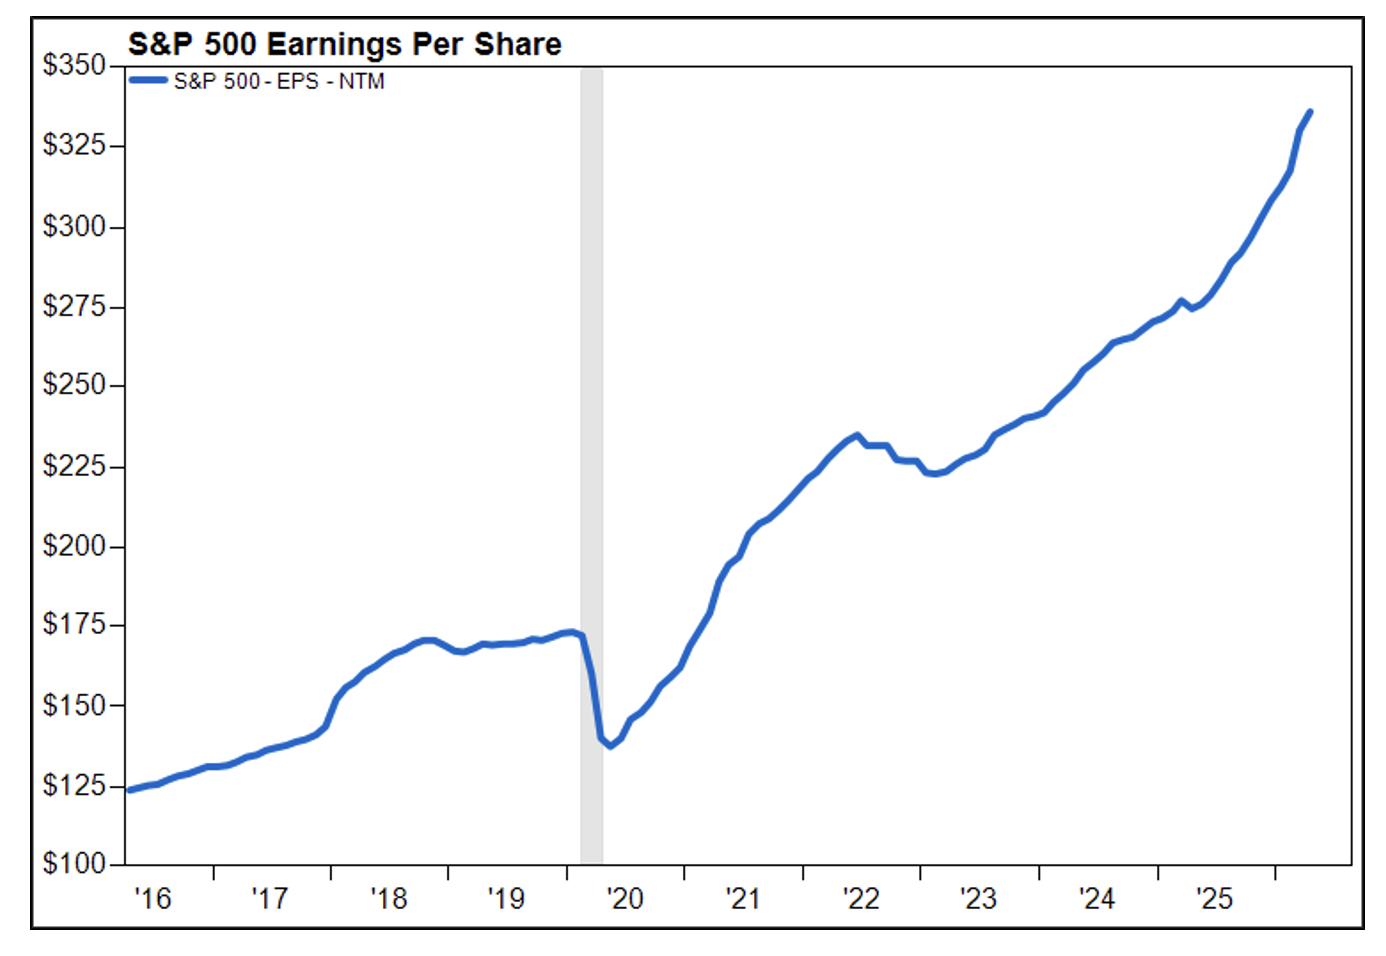
Perhaps the most meaningful takeaway from March volatility was that asset prices fell (excluding crude oil), but earnings expectations largely stayed in-tact. Entering the year, Wall Street analysts were expecting corporate earnings growth of 14%, which held steady throughout March and April.
Over the past ten years, the dominant driver of equity returns has been earnings growth rather than multiple expansion, particularly among the largest tech companies. That trend continued through the March episode, suggesting the pullback was driven more by macro uncertainty than by genuine deterioration in fundamentals.
Source: FactSet
Sector-Level Dislocation Reveals Pockets of Opportunity and Caution
- Mega cap growth sectors, particularly technology and communication services, absorbed a disproportionate share of the selling pressure in 1Q as investors questioned AI related capex levels and disruptions to traditional business models. Software stocks were hit especially hard, experiencing a -30% drawdown at their low in the first quarter. These sectors effectively retreated to their 10-year P/E average of about 25x represented by the NASDAQ Composite Index. This is an encouraging entry point for the sector under the context of attractive profit margins and earnings growth rates. Over the past five years, NASDAQ earnings growth has comfortably outpaced the S&P 500.
- Cyclical and value oriented sectors: Financials and industrials now sit close to or slightly below their 5 year average valuation multiples. These sectors have delivered lower but more stable earnings growth, with the former facing near-term concerns in private credit and the latter prone to swings in US trade policy and higher energy prices. Value stocks are outperforming growth stocks so far in 2026, with value up approximately 8% and growth up about 1%, as of 4/17.
- Defensive sectors suddenly appear expensive as we enter the Spring months. Utilities and consumer staples performed well in March, trading akin to shock absorbers during volatility. The crowded trade leaves utilities with an earnings multiple of 19x while consumer staples sits at a frothy 22x earnings. These valuation levels are somewhat concerning on a relative basis, as defensive sectors traditionally grow earnings at a lower but steady pace compared to other sectors.
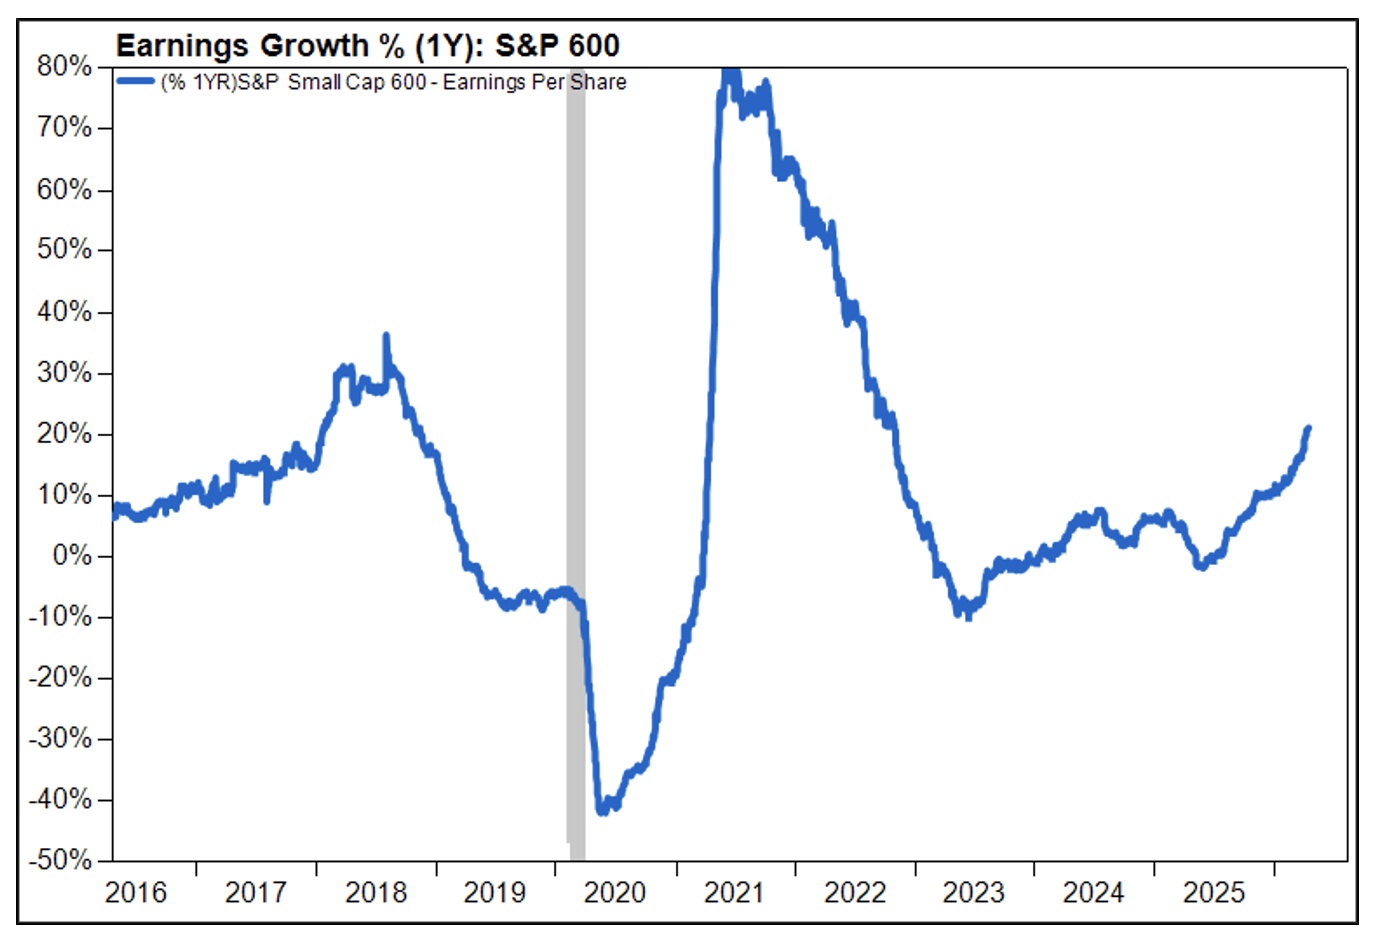
Small Caps: Valuation Relief, but Macro Sensitivity Remains
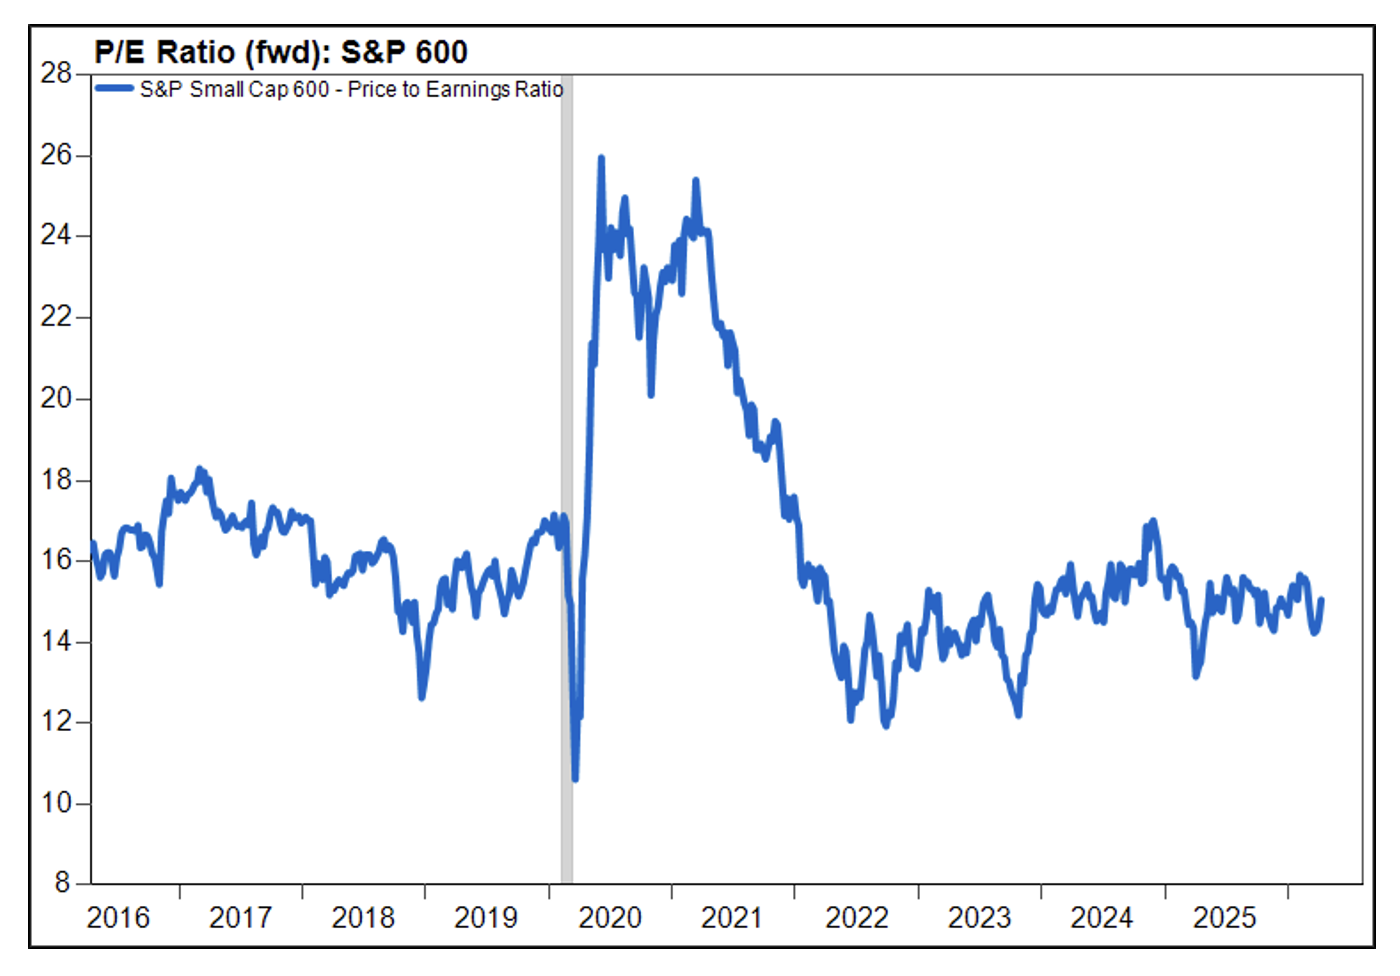
Small cap equities experienced a sharper valuation reset in March, with the asset class falling -4.1%; however, the S&P 600 Small Cap Index still managed to outperform the S&P 500 by approximately 780 basis points for the quarter.
Multiples now sit well below 10 year averages (see the chart below), and in some individual company cases even lower. From a valuation standpoint, small caps are among the most compelling segments of the equity market today.
Source: FactSet
That said, the discount is not accidental. Over the past five years, small cap earnings growth has been inconsistent, lagging large caps materially, and balance sheet sensitivity to interest rates remains elevated.
Source: FactSet
Small caps are better positioned if borrowing costs stabilize or ease but remain vulnerable if growth slows or credit tightens further. For now, we are leaning into a more optimistic scenario for the asset class.
Current Valuation Levels Present a Cautiously Optimistic Outlook
Earnings growth expectations held up substantially better compared to asset prices in March. Most large banks have reported 1Q earnings to date, painting an optimistic picture as consumers and companies remain in healthy shape despite geopolitical uncertainty. This gives us confidence that Wall Street will soon get back to focusing on fundamentals and (fingers crossed) put the worst case scenarios around the war in Iran behind us.
The April rally for stocks captures this pivot, as the S&P 500 and NASDAQ delivered a historic run over 12 trading sessions, which saw benchmark indices return 12.4% and 17.7% respectively from 3/30 – 4/17. The move is good for a top 1% return over comparable periods spanning the all-time history of the S&P.
Investors should perhaps dismiss the question of “whether stocks are expensive?” but rather, which areas of the market became dislocated in March and April? The March pullback primarily corrected sentiment and positioning, not fundamentals. If nominal growth remains positive, margins avoid significant compression, and rates stabilize near current levels, equities prices likely justify valuations that remain above historical averages—particularly outside the most crowded growth trades.
Further, the US dollar found some strength in March and credit spreads did not significantly widen, bolstering confidence.
We think the April rally underpins this bullish outlook. As such, Orion is leaning into risk assets into the second quarter.