


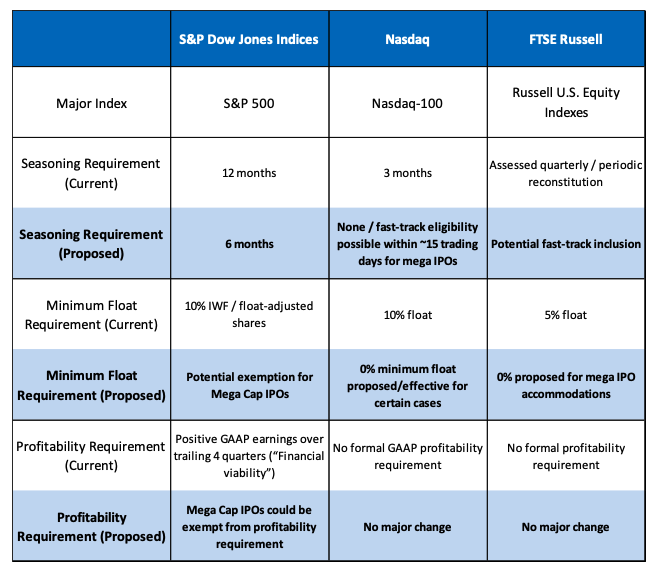
The potential wave of upcoming mega-IPOs has prompted major U.S. index providers to reconsider the rules governing benchmark index inclusion. S&P Dow Jones Indices, Nasdaq, and FTSE Russell, whose indices are tracked by major ETFs, mutual funds, and SMAs such as the S&P 500, Nasdaq-100, and Russell 1000 Growth Index, are reviewing potential changes to IPO seasoning periods (minimum amount of time a company must trade publicly after its IPO before becoming eligible for inclusion in a stock index) and minimum float (percentage of a company’s shares available for public trading and not held by insiders.) requirements. Reports have also suggested S&P may reconsider its profitability requirement, which currently requires companies to post positive GAAP earnings over the trailing four quarters before becoming eligible for indices such as the S&P 500.
Across all three providers, the broader goal is to ensure indices continue reflecting today’s investable public equity market while maintaining broad and relevant market exposure for investors.
Historically, IPOs and index inclusion were largely separate events. Companies would first go public, active managers would evaluate the business over time, and only later might the company become eligible for inclusion in major indices. In prior decades, IPO companies also tended to be smaller and less seasoned, while today many firms are remaining private for significantly longer due to the large amount of private capital available.
One factor driving the current index rule discussions is the size of the private companies reportedly considering near-term IPOs, including firms such as SpaceX, OpenAI, and Anthropic. To put the size of these IPOs into perspective, using conservative potential IPO raise estimates from investment banks of approximately $75B for SpaceX, $60B for OpenAI, and $60B for Anthropic, the combined IPO raise value of the three companies alone would surpass the cumulative amount of IPO capital raised in the peak of the internet cycle of 1999-2001 across thousands of companies. Another way to frame the size of these potential IPOs is to look at the companies’ latest reported private market valuations. SpaceX was reportedly valued at approximately $1.25 trillion, OpenAI at approximately $825 billion, and Anthropic at approximately $900 billion, combining for nearly $3 trillion in private market value that existing private investors have already gained on paper.
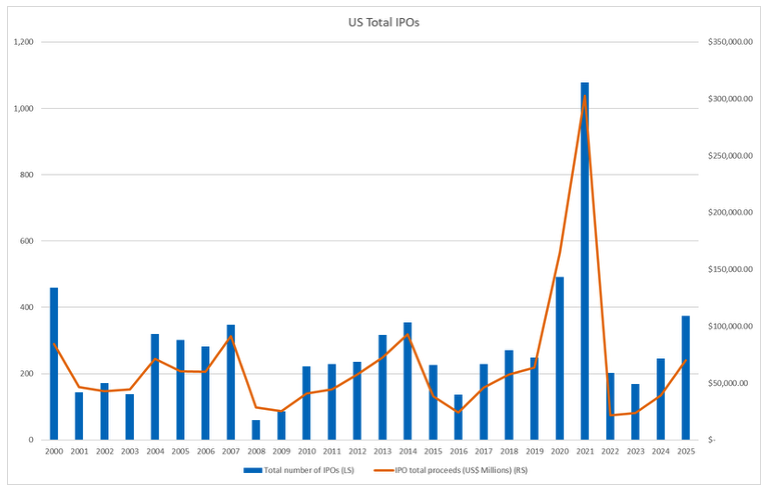
Following a weak 2022-2024 period, the U.S. IPO market is beginning to reaccelerate, with many on Wall Street expecting 2026 to become one of the largest IPO years on record by total deal value. The current IPO pipeline is heavily concentrated in areas such as artificial intelligence, aerospace and defense, AI infrastructure, fintech, and related technology industries.
(Data: US Securities and Exchange Commission)
Corporate governance has also become a major topic of debate within the IPO market, as many upcoming mega-IPOs are expected to feature dual-class voting structures, concentrated founder control, reduced shareholder rights, and relatively low public float percentages. As a result, investors increasingly view the next IPO cycle as a test of whether passive investment infrastructure can absorb exceptionally large new listings without creating meaningful distortions in fund flows, liquidity, or valuation dynamics.
IPOs may give investors exposure to some of the fastest-growing and most innovative areas of the economy, but historically they have also come with higher volatility, wider valuation dispersion, and greater downside risk than more seasoned public equities. While many IPOs see strong first-day returns, longer-term performance has been much more mixed, which reinforces the importance of valuation discipline, diversification, and careful security selection.
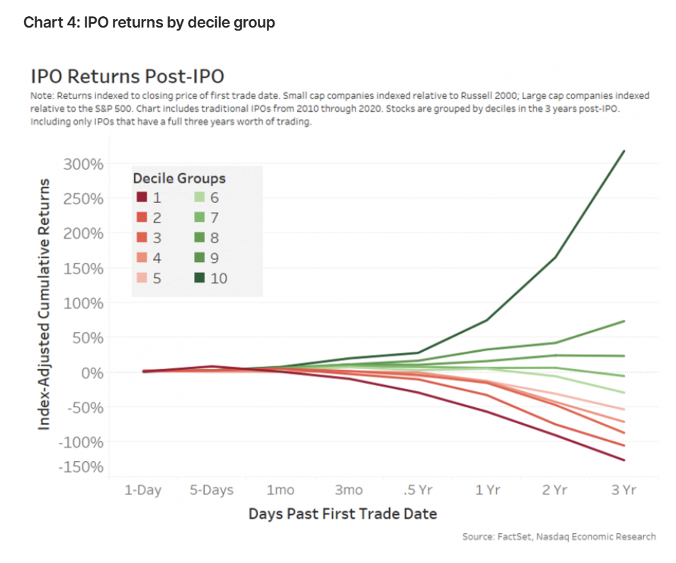
Nasdaq research on IPO performance from 2010–2020 compared small-cap IPOs against the Russell 2000 and large-cap IPOs against the S&P 500 to evaluate whether individual companies outperformed or underperformed their index peers. The research found that nearly two-thirds of IPOs underperformed the broader market over the three years following their public debut, with approximately 64% lagging the market by more than 10%. However, the study also showed the highly asymmetric nature of IPO returns, where a relatively small group of long-term winners drove a disproportionate share of total returns. The top 10% of IPOs produced average market-adjusted returns of more than 300%, showing the upside potential that can exist despite the broader dispersion of outcomes.
From a portfolio construction perspective, IPOs are generally best viewed as satellite growth allocations rather than core holdings because of their higher volatility, lower earnings visibility, and wider range of outcomes. This reinforces the importance of diversification and disciplined position sizing. Advisors and portfolio managers should evaluate IPO opportunities not only through revenue growth narratives, but also through governance structure, shareholder rights, dilution risk, path to profitability, free cash flow potential, competitive positioning, and the sustainability of long-term business advantages, among many other fundamental and portfolio construction considerations.
(Data: Nasdaq)
What does this all mean?
Bringing more companies to the public markets is generally a positive development for U.S. households, as public equities remain one of the primary ways investors gain exposure to growing businesses, innovation, and emerging industries. However, historical IPO performance reinforces the importance of diversification, valuation discipline, and prudent portfolio construction, as newly public companies often carry higher volatility, valuation uncertainty, and execution risk. While many IPOs may struggle over the long run, a relatively small group of successful companies has historically generated a disproportionate share of total returns, giving investors exposure to innovative businesses and secular growth themes.
At the same time, it is important to consider what evolving index inclusion rules may mean for the future composition of major equity indexes and broader capital allocation within markets. As index providers adjust requirements around seasoning periods, float thresholds, and profitability standards to accommodate mega-cap IPOs, the distinction between “passive” and “active” investing may become increasingly blurred. If index construction rules themselves influence which companies receive inclusion and passive capital flows, it raises important questions around market structure, valuation dynamics, and how capital is allocated across the broader equity market ecosystem over time.