





















Key Takeaways:
- Low index volatility is masking significant swings in individual stocks, as low correlations allow gains in some companies to offset losses in others, keeping the S&P 500 relatively calm despite turbulence beneath the surface.
- Market leadership has narrowed, with Technology and Energy outpacing the broader market on very different drivers, helping explain why diversified portfolios may trail the headline index even as it reaches record highs.
- For advisors, this environment reinforces the importance of reviewing concentrated positions, comparing client sector weights with the benchmark and maintaining disciplined rebalancing, particularly as correlations can rise quickly during market stress.
The S&P 500 set new record highs in the first full week of October. On the surface, it looks like a calm, steady market, and the VIX has spent most of the year at levels that suggest very little is happening. But if you have been watching individual stocks, you know that is not the case.
There is a lot going on under the hood.
This year, individual stocks have been far more volatile than the index they belong to. That gap is the real story of 2026, and it also explains two other features of this market that clients are starting to ask about: how much of the year's return is coming from just two sectors, and how few stocks are participating in the latest leg higher?
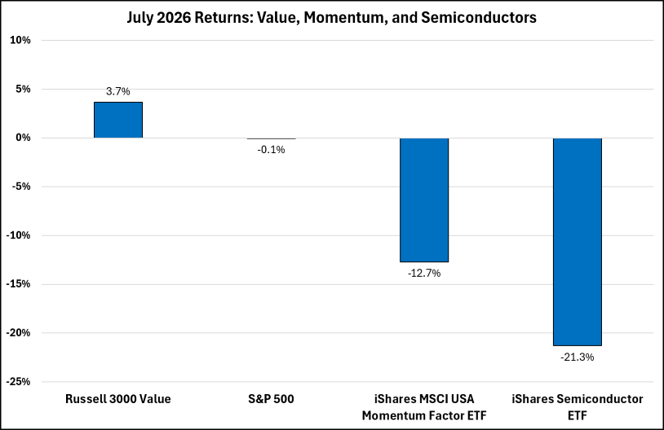
Consider July. The iShares Momentum ETF fell nearly 13%, while the leading trade, semiconductors, fell over 21%. Some measures mark July as the worst momentum unwind since 2000. Many of the year's biggest winners gave back months of gains in a matter of weeks, and yet, the S&P 500 finished July roughly flat. A collapse of that size, in the corner of the market that had been leading all year, barely registered at the index level.
Source: Factset
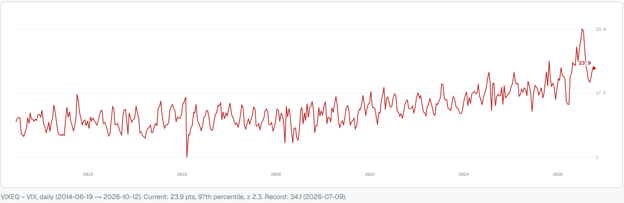
For most of the year, Cboe's measure of expected volatility for the average S&P 500 stock, VIXEQ, has run far above the VIX itself, and the spread between these measures (chart below), is in the 97th percentile since 2019. In plain terms, the market expects the typical stock to swing much more than the index. Outsized earnings reactions, AI headlines and sharp moves in commodity prices have pushed individual names around, while the index has quietly absorbed it.
Source: TradingView
The reason is correlation. Index volatility depends on two things: how much each stock moves, and how much stocks move together. When they move independently, one company's bad day is offset by another's good day, and the index stays calm even when its parts are not. Implied correlation among large U.S. stocks has spent much of 2026 near the lowest levels on record, leading to the “quiet” reading on the index level VIX.
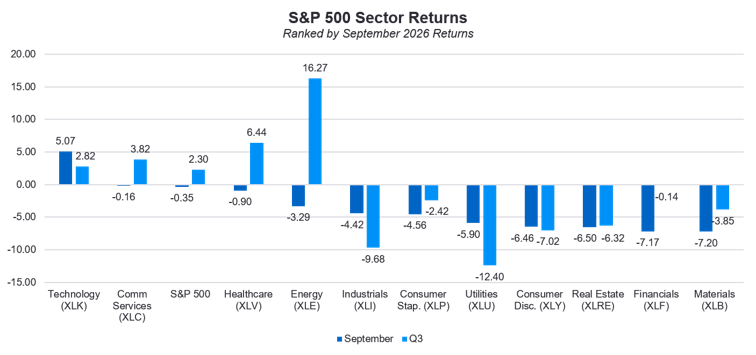
Looking to sector level performance, Technology (XLK) is up 37% and Energy (XLE) is up roughly 51% year to date, well ahead of the S&P 500, which is up about 15% (as of 10/12/2026). On paper, the two leading sectors are both winners, but in practice, they run on completely different fuel. Technology is a long-duration bet on AI spending and earnings growth while Energy is a bet on oil supply, inflation and geopolitics. The higher oil prices and rising yields that helped Energy in September, as the 10-year Treasury pushed past 5%, are typically headwinds for long-duration growth stocks.
This relationship can lead to the conclusion that these record highs are resting on a narrow base. In September, only the tech sector finished the month higher. Participation was broader earlier in the year, but it has narrowed considerably over the last two months. Additionally, the Equal Weight S&P 500 recently went on a losing streak while the S&P 500 charged forward. That is why so many well diversified portfolios are trailing the headline number right now.
Source: Morningstar Direct. As of 9/30/2026
Low correlation, by definition, is diversification doing its job, and narrow markets have often broadened out over time rather than broken down. But it is worth remembering how correlation behaves under stress. When a genuine shock hits, investors sell what they can, stocks start moving together, and index volatility rises quickly to meet the single stock volatility that was there all along. We saw that pattern in 2008, in March 2020 and again in the August 2024 yen carry trade unwind. A calm surface does not prevent that, it just hides how much is moving beneath it.
For advisors, the practical takeaways are straightforward. A low VIX is telling you less about client risk than usual, especially for clients holding concentrated positions in individual names. Many clients are living with stock level volatility, not index level volatility, and their position sizes should reflect that. Before the next performance conversation, it is worth comparing client sector weights to the benchmark so you can explain any gap before the client raises it. After strong double-digit runs in both Technology and Energy, adding to either is a bet that two very different trades keep working at the same time. And in a market with this much dispersion, disciplined rebalancing earns its keep by trimming what has run and adding to what has lagged.
The index may look calm, but the underlying names are anything but. Helping clients understand that difference is the best way to explain a record high that may not look much like their own portfolio.