Weekly Notes from Tim

By Tim Holland, CFA, Chief Investment Officer

  • Beyond trade, the topic most on Wall Street’s mind these days is monetary policy; more specifically when will the Federal Reserve cut rates. As of now, investors are convinced that after passing at its January, March, May, June and July meetings, the Fed will cut rates by a quarter point at its September meeting – and more than a few pundits believe the Fed wishes it had cut rates at its July meeting in light of the very disappointing July jobs report that landed just two days after the central bank met and decided to hold the Fed Funds Rate steady between a range of4.25% and 4.50%. Barring a bit of shockingly bad inflation data between now and the Fed meeting on September 17th, we think the Fed will cut next month, and we think the bond market is giving it the greenlight to do so. 
     
  • As we know the Fed has a dual mandate – maximum employment and stable prices – and the best explanation we have come across that speaks to how the Fed uses monetary policy to achieve those goals comes from the Fed itself (see box below). As the Fed notes, and we think most economists would agree, monetary policy most directly affects the current and expected future path of short-term interest rates. Well, the bond market seems to be anticipating a more dovish Fed, as the yield on the US 2 Year Note has fallen to 3.70%, more than 50 basis points below the Fed Funds Rate (see chart below). The bond market is giving the Fed the greenlight to cut rates in September, and maybe in October and December too. 
     
     
Picture 1

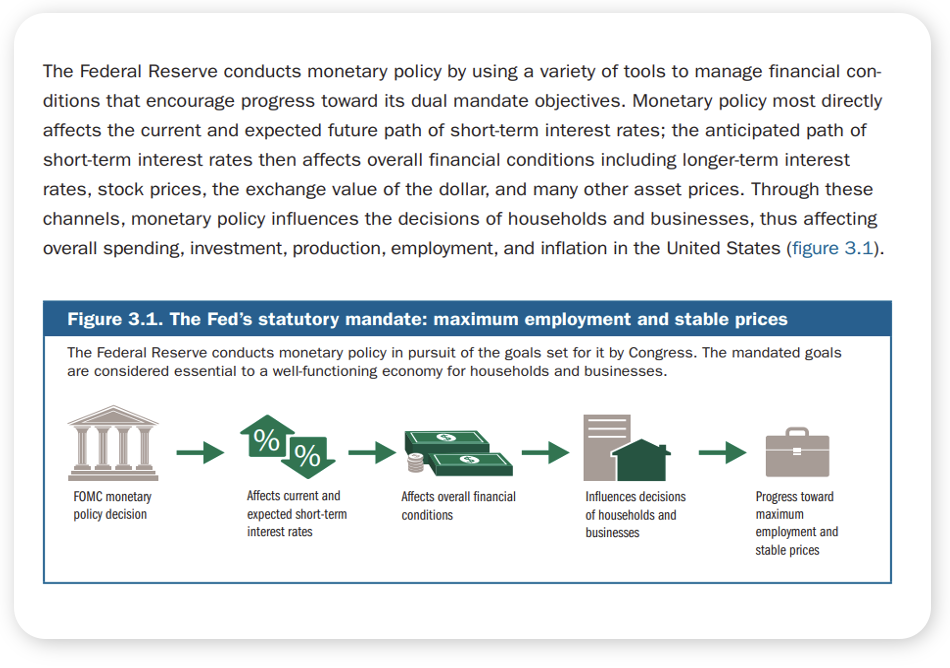
Source: Federal Reserve, 2025 


Picture 2

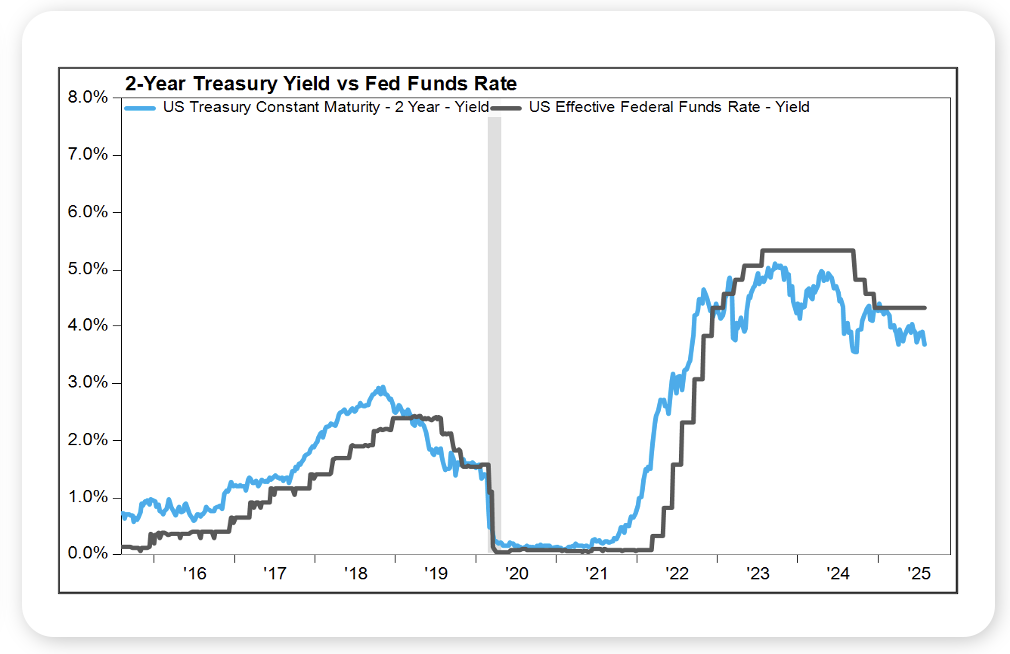
Source: Factset, August 2025


Looking Back, Looking Ahead

By Ben Vaske, BFA, Manager, Investment Strategy

Last Week

Equity markets pushed higher last week, with global equities gaining over 2% despite the reimplementation of many reciprocal US tariffs on August 7. Gains were led by US technology stocks and developed international equities, while the US dollar fell nearly 2% following a sharp rally the week prior. Fixed income prices fell slightly on higher rates, and all major asset classes remain positive year-to-date, with international equities still leading domestic and large caps ahead of small caps.

Q2 earnings results remain robust. With 90% of S&P 500 companies reporting, 81% have posted positive EPS and revenue surprises. Earnings growth for the quarter stands at 11.8%, marking the third consecutive quarter of double-digit growth.

Market structure trends continue to draw attention. The top 10 stocks in the S&P 500 now represent over 40% of the index, the highest concentration on record. The largest 10% of US stocks now make up 76% of total US equity market capitalization, surpassing prior peaks from the Dot-Com era. 

Economic data offered mixed signals. The US trade deficit narrowed slightly in June to $60.2 billion, below expectations. ISM’s Non-Manufacturing Index slipped to 50.1 in July, just above the expansion threshold, suggesting services activity is losing momentum. Labor market concerns remain in focus after recent softness in payroll data, though job openings have stopped declining — a potential sign that conditions may be stabilizing.

On the rates front, the yield curve steepened last week as short-term rates fell and long-term rates rose. The average mortgage rate declined slightly. The market-implied probability of a September rate cut climbed to 89% from 80% the prior week, with futures still pointing to two or three cuts before year-end. 
 

This Week

The week ahead brings key inflation data, with the July Consumer Price Index due for release. A softer-than-expected reading could push short-term rates lower as expectations for Fed easing strengthen, while an upside surprise may dampen that view.

Trade developments will also be watched closely, as the US and China face an August 12 deadline to extend their tariff pause or finalize a broader agreement. Earnings season continues, with several AI-related companies set to report.

Earnings season continues, but the heaviest reporting period is now behind us.


We hope you have a great week. If there’s anything we can do to help you, please feel free to reach out to ben.vaske@orion.com or opsresearch@orion.com.
 

Get Your Own Market Commentary

Client-Friendly Weekly Wire

Want a version of Weekly Wire you can send directly to your clients? Subscribe to our Weekly Wire newsletter and get a client-friendly version every Monday. Simply download, add your firm's logo, and use with your clients!


Key Data

Stocks, Bonds, Alternatives, and Real Assets as of August 8, 2025

Security Name

Risk Score

1 Wk

1 Mo

QTD

YTD

1 Yr

3 Yr Ann.

Global Equities (60% US, 40% Intl)

100

2.47%

2.29%

2.55%

13.76%

22.43%

15.70%

S&P 500 Total Return

102

2.44%

2.71%

3.07%

9.47%

21.73%

17.32%

Dow Jones Industrial Average

97

1.37%

-0.08%

0.29%

4.85%

13.98%

12.60%

NASDAQ 100 Total Return

122

3.73%

4.03%

4.15%

12.85%

29.20%

22.52%

TV Benchmark

107

2.52%

2.22%

2.50%

9.05%

21.64%

17.48%

Morningstar US Large Cap

102

2.91%

3.52%

3.63%

10.54%

24.14%

19.25%

Morningstar US Mid Cap

113

0.56%

-0.30%

0.75%

6.00%

15.52%

10.62%

Morningstar US Small Cap

125

1.06%

-0.55%

1.56%

2.33%

10.70%

8.17%

Morningstar US Value

98

1.47%

-0.89%

0.28%

6.12%

10.43%

11.64%

Morningstar US Growth

126

1.35%

2.76%

2.59%

11.21%

29.23%

16.42%

MSCI ACWI Ex USA

98

2.73%

1.78%

1.75%

20.39%

23.05%

13.78%

MSCI EAFE

101

2.87%

1.49%

1.05%

21.19%

22.12%

14.94%

MSCI EM

98

2.33%

2.06%

2.69%

18.99%

23.24%

11.04%

Bloomberg US Agg Bond Index

27

-0.18%

1.16%

0.37%

4.40%

3.59%

2.05%

Bloomberg High Yield Corp Bond Index

41

0.38%

0.72%

0.70%

5.30%

9.07%

7.75%

Bloomberg Commodity Index

70

0.25%

-2.15%

-0.75%

4.74%

10.65%

-0.28%

Wilshire Liquid Alternative Index

25

0.71%

0.68%

0.70%

3.44%

4.50%

4.12%

US Dollar

10

-1.57%

0.94%

1.57%

-9.30%

-4.65%

-2.64%

Bloomberg US Treasury Bill 1-3mo

1

0.09%

0.40%

0.49%

2.63%

4.67%

4.78%

Source: Morningstar

The TV Benchmark represents an average of the S&P 500, Dow Jones IA, and NASDAQ 100 return indexes. The Orion Risk Score represents risk relative to the global equity market.


Interest Rates as of August 8, 2025

Rate

This Week

1 Wk Δ%

13-Wk Treasury Yield

4.13%

-0.05%

10-Yr Treasury Yield

4.29%

0.06%

Bloomberg US Agg Yield

4.56%

0.02%

Avg Money Mkt Yield

4.13%

0.01%

Avg 30-Yr Mortgage Rate

6.75%

-0.03%

Sources: Yahoo Finance, S&P Global, Crane Data, BankRate


Key Economic Data Last Week

Data Point

Expectation

Actual

US Trade Deficit

-$61.0B

-$60.2B

ISM Services

51.1%

50.1%

Initial Jobless Claims

221,000

226,000

Consumer Credit

--

$7.6B

Source: MarketWatch


Key Economic Data This Week

Data Point

Expectation

Release Date

Consumer Price Index (CPI) YoY

2.8%

8/12/25

Core CPI YoY

3.1%

8/12/25

Producer Price Index (PPI) YoY

--

8/14/25

Core PPI YoY

--

8/14/25

U.S. Retail Sales

-0.5%

8/15/25

Source: MarketWatch

 
More Just for You

Want Resources for Your Clients?

Get a version of Weekly Wire you can send directly to your clients. Subscribe to our Weekly Wire newsletter and get a client-friendly version every Monday. Simply download, add your firm's logo, and use with your clients!

The views expressed herein are exclusively those of Orion Portfolio Solutions, LLC d/b/a Brinker Capital Investments, a registered Investment Advisor, and are not meant as investment advice and are subject to change. Information contained herein is derived from sources we believe to be reliable, however, we do not represent that this information is complete or accurate and it should not be relied upon as such. This information is prepared for general information only. It does not have regard to the specific investment objectives, financial situation, and the particular needs of any specific person.

An index is an unmanaged group of assets considered to be representative of a select segment or segments of the market in general, as determined by the index manager for the purposes of managing a specific index. You cannot invest directly in an index.

The CFA® is a globally respected, graduate-level investment credential established in 1962 and awarded by CFA Institute — the largest global association of investment professionals. To learn more about the CFA charter, visit www.cfainstitute.org.

Think2perform’s Behavioral Financial Advice program integrates traditional finance practices with psychology and neuroscience to improve emotional competency and decision-making behavior that increases effective usage of the financial plan with clients. To obtain the Behavioral Financial Advisor (BFA) designation, participants must complete a self-directed course, which takes 20-30 hours to complete, and includes a mix of interactive exercises, videos and case studies. To learn more about the BFA, visit https://www.think2perform.com.

Wealth Management services offered through Orion Portfolio Solutions, LLC d/b/a Brinker Capital Investments a registered investment advisor.