




















Our investment team is closely monitoring the developments in the Middle East and the impact they are having on commodity prices, the stock market, and the world economy. We lament the loss of innocent life, pray for the safety of U.S. troops in harm’s way and mourn the U.S. military servicemembers who have lost their lives.
You will continue to hear from us on the conflict with Iran. In the meantime, if you have any questions on the markets and the economy or if there is anything we can do to support you and your clients during this difficult time, please reach out to us via our Investment Strategy Team’s email address at opsresearch@orion.com.
Weekly Notes from Tim
By Tim Holland, CFA, Chief Investment Officer
- It’s been a rough run for equities, with the S&P 500, Russell 2000 and NASDAQ Composite off 1.2%, 2.8% and 4.1% in July as markets confront a few prominent Q2 earnings misses and, more importantly, higher oil prices as the war with Iran re-escalates (WTI trades at $90 a barrel, up $20 this month). As it concerns the spike in the price of oil, we think investors are worried higher oil prices will lead to higher inflation and, in turn, to higher interest rates, which will lead, in turn, to lower consumer spending and lower economic growth, if not outright recession (as we take pen to paper July 24th, Wall Street is now pricing in two 2026 Fed rate hikes).
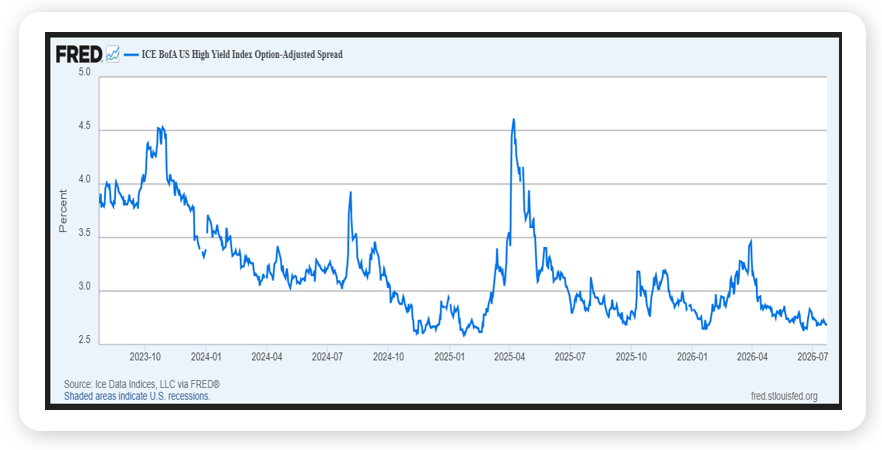
- When stocks fall and economic concerns rise, I like to check in with the "smart money" and, as any fixed income investor will gladly tell you, the smart money resides in the bond market (and I write that as someone who cut his professional teeth in the equity market). And while bonds have struggled due to the same inflationary concerns that have hit stocks, the bond market doesn’t seem that concerned about the US economy, at least if one believes that the spread between US high yield bonds and US Treasuries, or how much more in interest the former offer relative to the latter, can be viewed as a leading economic indicator.
- High yield bonds are issued by operationally and financially riskier US companies that are assumed to be more likely to default than investment grade companies, to say nothing of the US government (which presents very little default risk), and as such must pay investors a higher coupon – or level of interest – relative to investment grade issuers and the government as compensation for that elevated default risk. While the outlook for each high yield issuer is unique, we can look at pricing of high yield bonds in aggregate and infer what that pricing indicates about the economy. The ICE BofA US High Yield Index calculates the spread between an index of high yield US dollar denominated bonds and US Treasuries and, many would argue, the tighter the spread, the more optimistic bond investors are about the US economy and the wider the spread the more pessimistic bond investors are about the US economy (if the economy is strong and default risk is low, investors won’t demand much incremental income from high yield issuers, and vice versa). Well, that spread is at a multi-year low and below where it was as the war with Iran hit its then zenith in March (see chart). For now, it seems, the smart money isn’t that worried about America’s economic outlook, and neither are we.
Federal Reserve Bank of St. Louis, July 2026
Looking Back, Looking Ahead
By Ben Vaske, CFA, Manager, Investment Strategy
Last Week
It was a risk-off week for most equity categories, with the NASDAQ 100 leading declines at roughly 2% as the semiconductor selloff continued to weigh on growth stocks. The iShares Semiconductor ETF is now down over 20% from its early June peak, pressured by the ongoing threat of Chinese open-source AI models and a production delay announcement from Google on Thursday. Value stocks held up as the relative winner, with U.S. value gaining just over 1% on the week. International markets quietly outperformed, with both emerging markets and developed international posting modest gains, a reversal from recent weeks. Commodities were the standout, rising nearly 3% as WTI crude oil surged roughly 9% following a renewed breakdown in Strait of Hormuz traffic and continued fragility in U.S.-Iran ceasefire negotiations. Fixed income struggled, with the Bloomberg Agg off roughly 1% as interest rates rose across the board heading into this week's FOMC meeting.
On the earnings front, Q2 season is delivering at a historic pace. With 27% of S&P 500 companies having reported, blended year-over-year earnings growth is tracking at 37.9%, which would be the strongest quarterly result since Q3 2021, and 86% of reporters have beaten EPS estimates. Beneath the index surface, dispersion remains extreme: energy is up 34% year-to-date and capital goods up 21%, while software is down 20% and autos off 26%, a backdrop that increasingly favors active, bottom-up portfolio construction alongside passive core exposure.
This Week
It is one of the busiest weeks of the year. The FOMC announces its rate decision Wednesday, with markets pricing a 66% probability of a hold and a 34% chance of a 25 basis point hike. Kevin Warsh's press conference will be closely watched for any shift in tone following last week's oil price surge and renewed Middle East tensions.
Thursday brings both the first estimate of Q2 GDP and the PCE inflation reading, two of the most consequential data releases of the quarter.
On the earnings calendar, four Magnificent 7 companies report this week, with Microsoft, Meta, Amazon, and Apple all set to release results in what shapes up to be the most important stretch of the Q2 earnings season.