


Our investment team is closely monitoring the developments in the Middle East and the impact they are having on commodity prices, the stock market, and the world economy. We lament the loss of innocent life, pray for the safety of U.S. troops in harm’s way and mourn the U.S. military servicemembers who have lost their lives.
You will continue to hear from us on the conflict with Iran. In the meantime, if you have any questions on the markets and the economy or if there is anything we can do to support you and your clients during this difficult time, please reach out to us via our Investment Strategy Team’s email address at opsresearch@orion.com.
Weekly Notes from Tim
By Tim Holland, CFA, Chief Investment Officer
- We are deep into the NBA playoffs, and as I take pen to paper my Knicks have vanquished the 76ers in the Eastern Conference Semi-Finals (this note might not land well in Orion’s Philadelphia office; the fact NY is led by three Villanova standouts hopefully buys me some grace). I love basketball, though I am not so sure I love the modern game where the 3-point shot has come to dominate, and don’t even get me started on the G.O.A.T debate – it is Michael Jordan. And speaking of Michael Jordan, we know that even the greatest of all time can’t win it all on his own (think Jordan and the Bulls without Scottie Pippen). Which brings us to the subject of this week’s note, the market’s remarkable run and the fact it isn’t just about the S&P 500 – and what that might mean for returns going forward.
- Off the late March market lows, through May 8, the S&P 500 Index has gained 17%, while the S&P Mid Cap 400 Index is up 12% and the S&P 600 Index, a key benchmark for US small cap stocks, has returned 15%; on a year-to-date basis, the S&P 600 is up 15%, the S&P 400 is up 12% and the S&P 500 is up 8% (see chart). The US is home to the world’s biggest, most dominant publicly traded companies, but the 2026 rally has been about much more than US large cap stocks; consider that the S&P 500, the S&P 400, the S&P 600, and the Nasdaq and the Russell 2000, another US small cap benchmark, all hit record highs last week.
- As it concerns fundamentals, the S&P 400 and S&P 600 trade at price to earnings ratios below their expected earnings growth rates for 2026, while the S&P 500 trades at a price to earnings ratio in line with its expected 2026 earnings growth, so there is a bit more valuation support down the cap spectrum. As it concerns, the macro backdrop, smaller companies tend to be more sensitive to short term borrowing costs and economic conditions, so an environment where the cost of capital is moving higher and economic growth is moving lower should present problems for those stocks. The strength of small and mid cap companies has us optimistic inflation fears tied to higher oil prices won’t translate into higher interest rates and geo-political uncertainty won’t upend the US economy through 2026.
- For now, large, mid and small cap companies are scoring meaningful gains for investors. If history is any guide, the breadth of this rally should foreshadow future gains for a US bull market that is just five months shy of its fifth birthday.
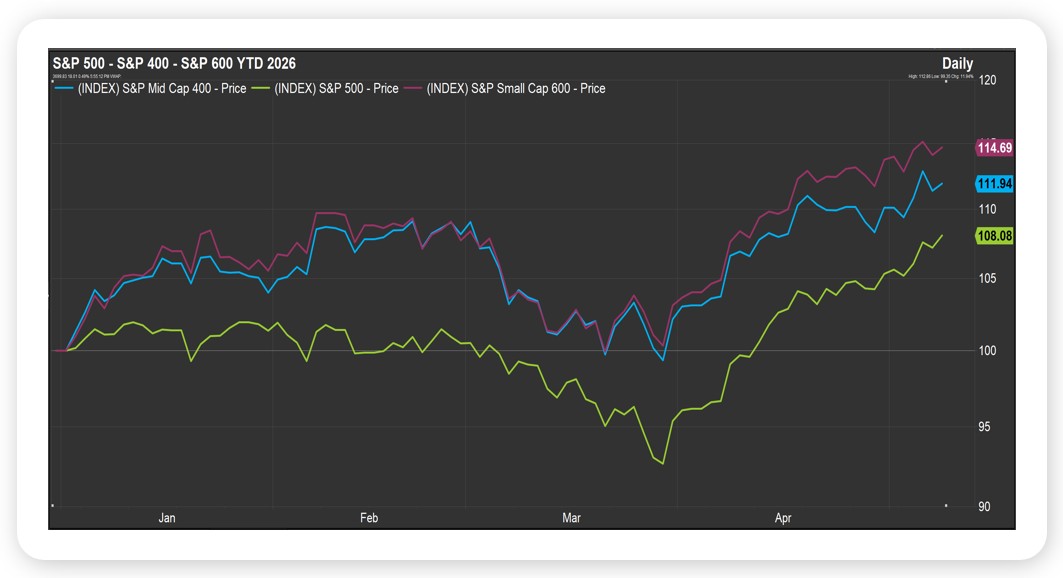
Source, FactSet, May 2026
Looking Back, Looking Ahead
By Ben Vaske, BFA, Manager, Investment Strategy
Last Week
U.S. markets continued their impressive run last week, with the S&P 500 and NASDAQ 100 extending their winning streak to six consecutive weeks and closing at fresh record highs. The NASDAQ 100 was the standout performer, gaining roughly 5.5% on the week alone. The S&P 500 is now up over 9% and the NASDAQ over 17% over the trailing 30 days, a stretch that has allowed U.S. large caps to surpass developed international equities year-to-date, though emerging markets continue to lead all equity classes. Fixed income was roughly flat on the week as short and intermediate rates held steady.
The April employment report was a bright spot, with the economy adding 115,000 jobs against consensus expectations of around 55,000. The unemployment rate held steady at 4.3%, though a closer look revealed some softness beneath the headline, including a 92,000 decline in labor force participation and a participation rate that fell to its lowest level since 2021.
Q1 S&P 500 earnings results continue to impress, with blended S&P 500 earnings growth now tracking at 27.7% year-over-year with 89% of companies having reported. The top 10 index constituents remain the primary engine of that growth, accounting for 33% of total index earnings.
This Week
Inflation moves back into focus this week, with the Consumer Price Index and the Producer Price Index being released this week. Both are expected to reflect the impact of higher oil prices, and retail sales data will also be worth watching after last month's outsized reading.
The Fed Chair transition is likely to dominate investor attention, as Jerome Powell's term officially ends May 15th and Kevin Warsh's Senate confirmation has yet to be finalized. Markets are currently pricing a 93% probability of a hold at the June 17th FOMC meeting, making the transition itself and any related commentary a key variable for the weeks ahead.
We hope you have a great week. If there’s anything we can do to help you, please feel free to reach out to ben.vaske@orion.com or opsresearch@orion.com.