


Our investment team is closely monitoring the developments in the Middle East and the impact they are having on commodity prices, the stock market, and the world economy. We lament the loss of innocent life, pray for the safety of U.S. troops in harm’s way and mourn the U.S. military servicemembers who have lost their lives.
You will continue to hear from us on the conflict with Iran. In the meantime, if you have any questions on the markets and the economy or if there is anything we can do to support you and your clients during this difficult time, please reach out to us via our Investment Strategy Team’s email address at opsresearch@orion.com.
Weekly Notes from Tim
By Tim Holland, CFA, Chief Investment Officer
- As a child of the 70s, I am pretty sure I never received a participation trophy for sports, or any other activities – at least none that I can recall. Now, I am not saying that participation trophies are a bad thing – my kids have received their fair share – or that my generation – Gen X – was cooler or tougher than the ones that followed, just that it was different back then, as a kid you were kind of on your own. Either way, participation, or the lack thereof, is the subject of this week’s note.
- The March jobs report published April 3rd was well received, with 178K jobs added last month and the unemployment rate falling to 4.3% (Wall Street was looking for 55K jobs added and a 4.4% unemployment rate). Another labor market datapoint that was also released April 3rd that was less well received was the labor force participation rate, which represents the percentage of the civilian working age population that is working or looking for work, which came in at 61.9%, down from 62% in March. The reason the report was not well received didn’t really have anything to do with the 0.1% month to month drop or the number missing expectations (as far as I can tell, there is no Wall Street consensus estimate for the report), it was the absolute level that it came in at, 61.9%, a 50-year low, excluding the Covid era driven drop, and more than five points below the all time high hit in April of 2000 (see chart).
- We know the US is older than it has ever been, and that the Baby Boom generation has been leaving the work force since the early 2000s, so it isn’t unexpected that the labor force participation rate would be much lower than it was some 20 years ago; that written, I think most economists were hoping that the post-pandemic bounce in the participation rate would have proven sustainable, instead of lasting – at least as of now – for just three and half years.
- Why this matters is that two factors drive economic growth – people (the size of the labor force) and productivity (how much those people produce in goods and services). Ideally, an economy is home to an expanding labor force that is increasingly productive. If you can’t have both of those factors in your favor, you hopefully have at least one and you hope that one is more than sufficient to compensate for the other, if that makes sense.
- If there is an upside to what seems to be an ever-falling US labor force participation rate, it might be more consistent and meaningful wage gains for American workers, and the mitigation of any potential AI driven disruption to the labor market (fewer employees means fewer employees that might lose their job to a seemingly ascendent technology). If nothing else, it seems the US will be leaning a bit more heavily on productivity gains to drive growth going forward.
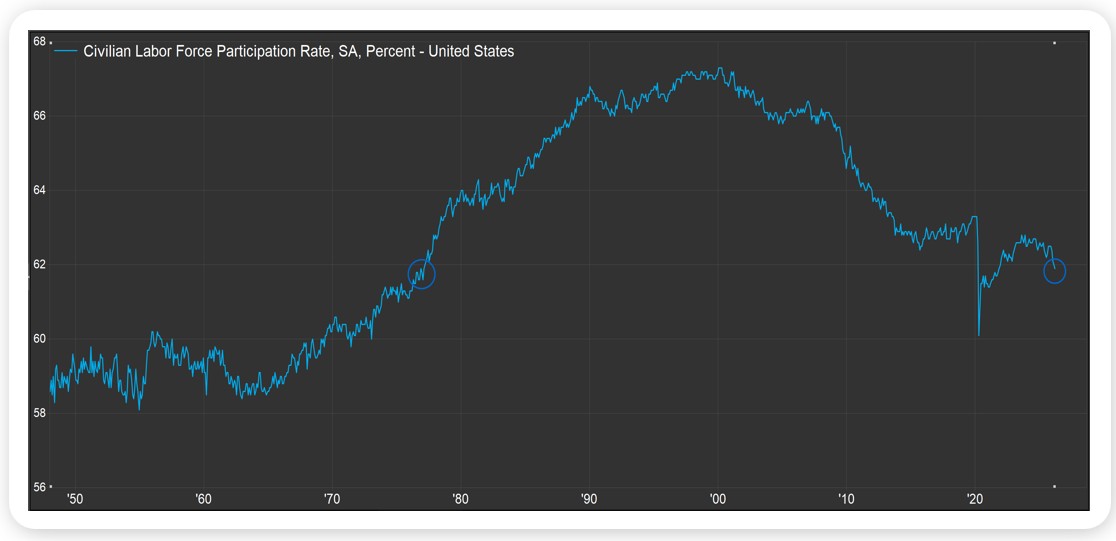
Source, Factset April 2026
Looking Back, Looking Ahead
By Ben Vaske, BFA, Manager, Investment Strategy
Last Week
Markets saw a strong continuation of the recent rally last week, driven largely by a mid-week cease-fire announcement between the U.S./Israel and Iran. The news sparked a sharp risk-on move, with the S&P 500 posting its second consecutive week of gains over 3%, a streak not seen since October 2022. While some of those gains faded into the end of the week as uncertainty around the durability of the cease-fire emerged, sentiment remained broadly positive going into the weekend.
Performance was broadly strong across asset classes. Emerging markets led with gains near 8% on the week, while developed international equities rose roughly 4.5%. U.S. equities also participated in the rally, with the NASDAQ 100 leading major indexes higher. Major U.S. benchmarks are now approaching flat on the year after earlier drawdowns tied to geopolitics and the software selloff, while small caps, mid caps, and value stocks remain solidly positive year to date. Fixed income also benefited from easing yields, with high yield outperforming investment grade as risk premiums compressed.
Economic data reflected a mixed but manageable backdrop. Inflation moved higher, with CPI rising to 3.3% year over year, driven largely by energy prices following the recent oil shock. At the same time, growth expectations softened as fourth quarter GDP was revised down to 0.5%, highlighting slowing momentum even as underlying corporate fundamentals remain resilient.
This Week
Geopolitics remain the key driver to start the week, as optimism from last week’s cease-fire has quickly been challenged. Over the weekend, negotiations between the U.S. and Iran failed to produce a lasting agreement, and the announcement of a U.S. blockade of the Strait of Hormuz has reintroduced volatility, with equity futures pointing lower and oil prices moving higher.
It is a lighter week for economic data, but inflation will remain in focus. The Producer Price Index will provide additional insight into input cost pressures following last week’s CPI report, particularly as energy prices continue to influence the inflation outlook. Investors will also be watching how persistent oil volatility feeds into broader inflation expectations and what that may mean for the Federal Reserve’s policy path in the weeks ahead.
We hope you have a great week. If there’s anything we can do to help you, please feel free to reach out to ben.vaske@orion.com or opsresearch@orion.com.