Weekly Notes from Tim

By Tim Holland, CFA, Chief Investment Officer

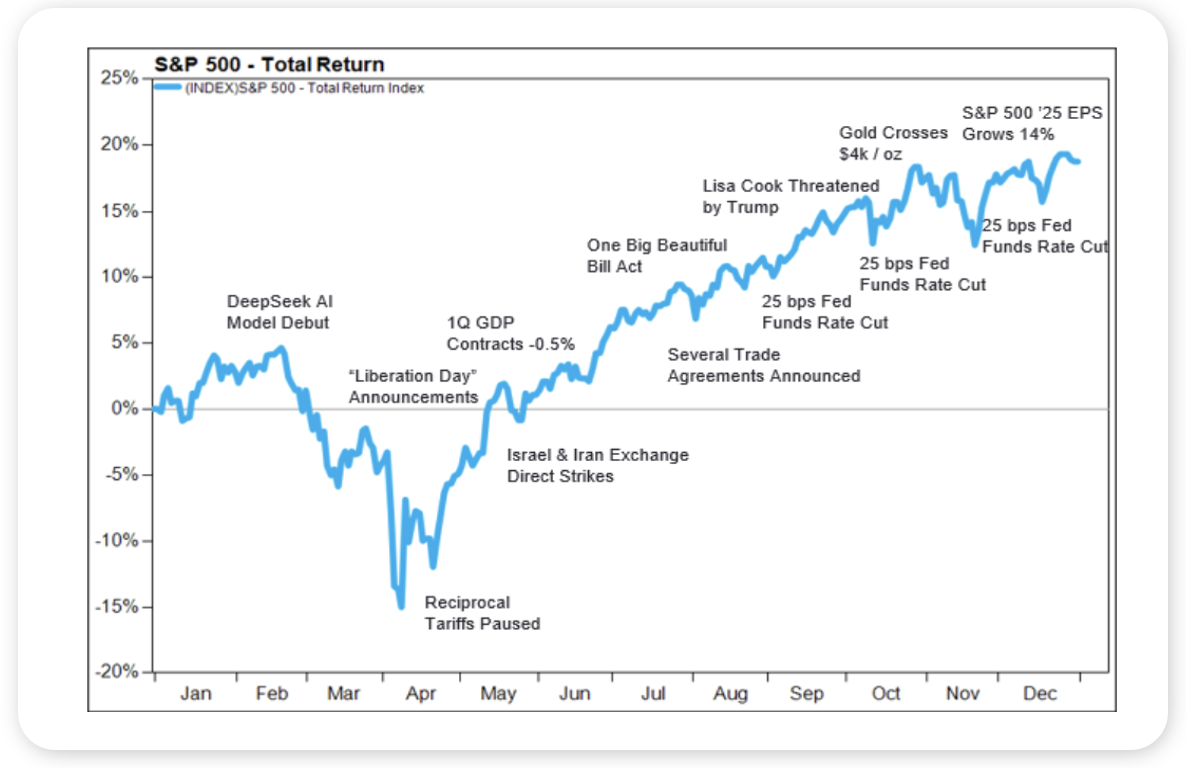
  • The S&P 500 was up 17.8% in 2025, the third consecutive year of an above average return for the world’s most important equity index (the S&P having gained 25% in 2024 and 26% in 2023). If one considers the headwinds buffeting the market last year, including “Liberation Day” tariffs, a negative Q1 GDP print and war in the Middle East (see chart), the performance of US stocks is even more impressive. And as we say hello to 2026, investors rightly wonder if the S&P 500 can “Four-Peat” and deliver a fourth consecutive year of gains. We think it can, but a “Four-Peat” likely stands on these “F.E.A.T.” (The Fed, Earnings, AI and Trade).
     
  • The Fed – three quarter point rate cuts in 2025 were a tailwind for stocks (and bonds). Wall Street expects two quarter point rate cuts in 2026. We don’t think the market needs the Fed to be super accommodative in the new year, but what investors don’t want to see is an inflation scare and a pivot back to rate hikes.
     
  • Earnings – the S&P 500 has strung together four consecutive quarters of double-digit earnings growth and Wall Street expects 14% earnings per share growth in 2026. Robust earnings growth would do much to mitigate concerns over the market’s multiple (the S&P 500 trades at an elevated 22x next twelve months EPS). 
     
  • AI – the AI trade wobbled a few times in 2025, early in the year when China’s DeepSeek released its large language model and later in the year when Wall Street grew concerned about overvaluation and overspending among the public (e.g., Oracle) and private (e.g., OpenAI) companies driving the AI trade. Investors will likely want to see the AI cap ex cycle continue in 2026 but also want greater evidence that recent and expected investments will prove profitable.
     
  • Trade – The Trump Administration inking trade deals with the EU, UK and Japan, and tariff rates coming in below “Liberation Day” expectations boosted investor sentiment in 2025. That said, the US still needs to solve for trade with China, Mexico and Canada in 2026. 
     
  • If history is any guide, the US economy and US markets will face challenges this year, and stocks will experience periods of great volatility, but when all is said and done, we believe the economy should grow and stocks should rise. And before you know it, we will be looking back on 2026 and looking ahead to 2027. 
     
Picture 1

Source: FactSet, December 2025


Looking Back, Looking Ahead

By Ben Vaske, BFA, Manager, Investment Strategy

Last Week

Domestic markets closed out the final week of the year slightly lower in holiday-shortened trading. U.S. equities posted modest declines, led by weakness in large caps and technology, while value and small caps held up better. Interest rates moved slightly higher, which pressured investment grade bonds.

The U.S. dollar strengthened modestly last week, gaining about 35 bps. Even so, international equities continued their relative strength into year-end. Emerging market equities gained more than 2% just last week and finished 2025 as the top-performing equity asset class.

Geopolitics returned to the spotlight over the weekend after the U.S. conducted a military operation in Venezuela and captured Nicolas Maduro. Markets, particularly oil, will be closely watched for any near-term reaction. Historically, market responses to geopolitical shocks tend to be temporary, with fundamentals regaining focus once uncertainty fades.

Despite the soft finish in the US, 2025 was a strong year overall. All major asset classes finished positive, including U.S. and international equities, investment grade and high yield bonds, alternatives, and real assets. Balanced, globally diversified portfolios delivered solid returns through a volatile year.
 

This Week

It is the first full trading week of the new year, and the economic calendar is busy. Key releases include ISM Manufacturing, ADP Employment, Consumer Credit, the U.S. Trade Balance, Nonfarm Payrolls, and the University of Michigan Consumer Sentiment Survey.

Markets will also continue to digest geopolitical developments following events in Venezuela, including potential implications for crude oil. Venezuela holds the world’s largest proven oil reserves, and any shift in U.S. sanctions or trade flows could have implications for heavy crude markets.

As investors enter 2026, optimism remains elevated. The percentage of U.S. consumers expecting stock prices to be higher over the next 12 months sits near historic highs. While reasons for caution are always present, the long-term takeaway remains unchanged: staying invested matters far more than trying to time short-term market moves.

We hope you have a great week. If there’s anything we can do to help you, please feel free to reach out to ben.vaske@orion.com or opsresearch@orion.com.
 

Get Your Own Market Commentary

Client-Friendly Weekly Wire

Want a version of Weekly Wire you can send directly to your clients? Subscribe to our Weekly Wire newsletter and get a client-friendly version every Monday. Simply download, add your firm's logo, and use with your clients!


Key Data

Stocks, Bonds, Alternatives, and Real Assets as of January 2, 2026

Security Name

Risk Score

1 Wk

1 Mo

QTD

YTD

1 Yr

3 Yr Ann.

Global Equities (60% US, 40% Intl)

100

-0.19%

1.95%

0.55%

0.55%

24.46%

20.89%

S&P 500 Total Return

102

-1.00%

0.55%

0.21%

0.21%

18.39%

23.09%

Dow Jones Industrial Average

97

-0.66%

2.03%

0.68%

0.68%

16.12%

15.62%

NASDAQ 100 Total Return

122

-1.69%

-1.30%

-0.16%

-0.16%

21.04%

33.13%

TV Benchmark

107

-1.12%

0.43%

0.24%

0.24%

18.52%

23.95%

Morningstar US Large Cap

102

-1.12%

0.16%

0.05%

0.05%

20.07%

25.79%

Morningstar US Mid Cap

113

-0.46%

1.71%

1.00%

1.00%

11.29%

14.23%

Morningstar US Small Cap

125

-0.70%

2.58%

1.23%

1.23%

13.80%

14.93%

Morningstar US Value

98

-0.17%

2.55%

0.73%

0.73%

18.27%

14.58%

Morningstar US Growth

126

-1.20%

0.85%

0.97%

0.97%

14.74%

25.30%

MSCI ACWI Ex USA

98

1.00%

4.09%

0.95%

0.95%

34.55%

18.17%

MSCI EAFE

101

0.56%

3.86%

0.60%

0.60%

32.78%

17.81%

MSCI EM

98

2.34%

4.33%

1.79%

1.79%

37.23%

17.68%

Bloomberg US Agg Bond Index

27

-0.21%

-0.07%

-0.20%

-0.20%

7.04%

4.59%

Bloomberg High Yield Corp Bond Index

41

0.20%

0.63%

0.00%

0.00%

8.44%

10.06%

Bloomberg Commodity Index

70

-2.57%

-0.41%

-0.14%

-0.14%

14.60%

3.91%

Wilshire Liquid Alternative Index

25

-0.48%

-0.61%

0.11%

0.11%

6.06%

5.62%

MSCI US REIT

104

-0.16%

-0.83%

0.27%

0.27%

4.12%

8.49%

US Dollar

10

0.35%

-1.10%

0.00%

0.00%

-9.37%

-1.70%

Bloomberg US Treasury Bill 1-3mo

1

0.07%

0.34%

0.03%

0.03%

4.31%

4.93%

Source: Morningstar

The TV Benchmark represents an average of the S&P 500, Dow Jones IA, and NASDAQ 100 return indexes. The Orion Risk Score represents risk relative to the global equity market.


Interest Rates as of January 2, 2026

Rate

This Week

1 Wk Δ%

13-Wk Treasury Yield

3.53%

-0.01%

10-Yr Treasury Yield

4.19%

0.05%

Bloomberg US Agg Yield

4.35%

0.03%

Avg Money Mkt Yield

3.58%

0.01%

Avg 30-Yr Mortgage Rate

6.25%

-0.03%

Sources: Yahoo Finance, S&P Global, Crane Data, BankRate


Key Economic Data Last Week

Data Point

Expectation

Actual

Pending Home Sales

1.0%

3.3%

S&P Case-Shiller Home Price Index

1.1%

1.3%

Chicago Business Barometer

40.0

43.5

Source: MarketWatch


Key Economic Data This Week

Data Point

Expectation

Release Date

ISM Manufacturing

48.3

1/5/26

ADP Employment

45,000

1/7/26

ISM Services

52.1

1/7/26

U.S. Trade Deficit

$58B

1/8/26

U.S. Consumer Credit

$12.4B

1/8/26

U.S. Employment Report

54,000

1/9/26

U.S. Unemployment Rate

4.7%

1/9/26

Source: MarketWatch

 
More Just for You

Want Resources for Your Clients?

Get a version of Weekly Wire you can send directly to your clients. Subscribe to our Weekly Wire newsletter and get a client-friendly version every Monday. Simply download, add your firm's logo, and use with your clients!

The views expressed herein are exclusively those of Orion Portfolio Solutions, LLC d/b/a Brinker Capital Investments, a registered Investment Advisor, and are not meant as investment advice and are subject to change. Information contained herein is derived from sources we believe to be reliable, however, we do not represent that this information is complete or accurate and it should not be relied upon as such. This information is prepared for general information only. It does not have regard to the specific investment objectives, financial situation, and the particular needs of any specific person.

An index is an unmanaged group of assets considered to be representative of a select segment or segments of the market in general, as determined by the index manager for the purposes of managing a specific index. You cannot invest directly in an index.

The CFA® is a globally respected, graduate-level investment credential established in 1962 and awarded by CFA Institute — the largest global association of investment professionals. To learn more about the CFA charter, visit www.cfainstitute.org.

Think2perform’s Behavioral Financial Advice program integrates traditional finance practices with psychology and neuroscience to improve emotional competency and decision-making behavior that increases effective usage of the financial plan with clients. To obtain the Behavioral Financial Advisor (BFA) designation, participants must complete a self-directed course, which takes 20-30 hours to complete, and includes a mix of interactive exercises, videos and case studies. To learn more about the BFA, visit https://www.think2perform.com.

Wealth management services provided by Orion Portfolio Solutions, LLC (“OPS”), a registered investment advisor. Orion OCIO services provided by TownSquare Capital, LLC (“TSC”), a registered investment advisors. OPS and TSC are affiliates and wholly owned subsidiaries of Orion Advisor Solutions, Inc.