Our investment team is closely monitoring the developments in the Middle East with an eye towards understanding how the events might impact commodity prices, the stock market, and the world economy. We lament the loss of innocent life, pray for the safety of U.S. troops in harm’s way and mourn the U.S. military servicemembers who have lost their lives. 

You should be hearing from us often over the coming days on the conflict with Iran. For now, we are not expecting any meaningful changes to our market and economic outlook or our current asset allocation. As it concerns this week’s note…

Weekly Notes from Tim

By Tim Holland, CFA, Chief Investment Officer

  • From a markets point of view, 2026 looks a lot like 2025. Consider sources of volatility – trade (the Supreme Court ruling against the Trump Administration on the use of tariffs) and AI (though concerns of late have been less about an AI bubble and more about the technology disrupting if not outright disintermediating any number of technology and consumer services companies) and performance – international equities are easily outdistancing US equities (the MSCI EAFE Index and the MSCI EM Index are up 9% and 15%, respectively, year to date vs a gain of 1% for the S&P 500 as of February 27th).
     
  • When Orion’s Asset Allocation Committee upgraded international equities in early 2025, it cited attractive valuation as one reason for its more constructive outlook on the asset class. Another reason, and key to the Committee’s decision, was the emergence of pro-growth fiscal policies in Europe, particularly Germany, the region’s largest economy, and an economy that had been in or just barely out of recession the past few years.
     
  • More specifically, we thought the decision by the German government to invest up to $1 trillion in defense and infrastructure would prove economically stimulative (both on its own and by spurring private sector investment). And the economic situation in Germany is brightening, with manufacturing orders increasing a much better than expected 7.8% in December, the strongest increase in two years (see chart). There are multiple reasons to be bullish on ex-US markets; there is the forementioned attractive valuation, along with improving earnings growth, a weaker dollar and a general under allocation to the asset class by US investors. Being able to add improving growth in Europe’s largest – and the world’s third largest – economy to that list in 2026 would be a big deal. 
Picture 1

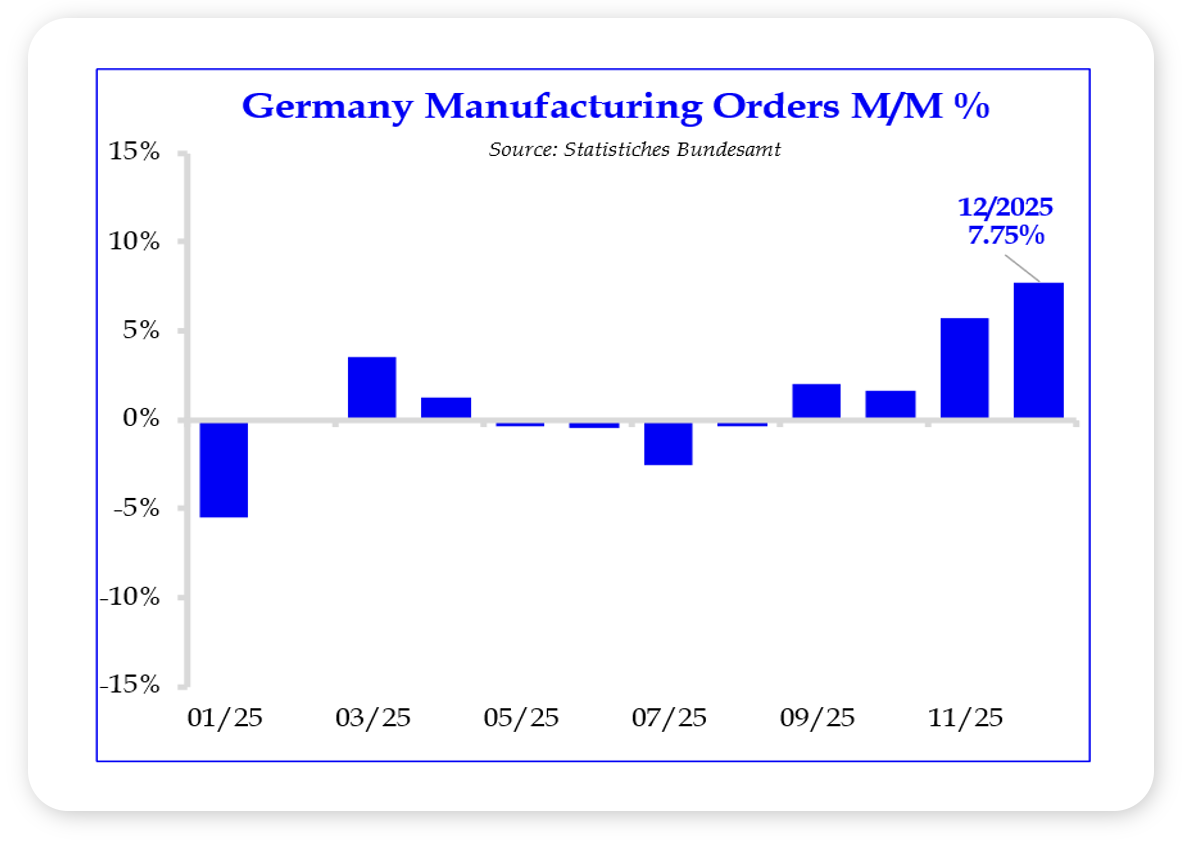
Source: Strategas, February 2026


Looking Back, Looking Ahead

By Ben Vaske, BFA, Manager, Investment Strategy

Last Week

Markets were mixed overall, though global equities finished positive. Emerging markets stood out with nearly 3% gains, while U.S. performance was weaker outside of mid-caps. Developed and emerging international markets continue to lead in 2026, with both now in double-digit return territory through just the first two months of the year. By contrast, the S&P 500 is up less than 1% YTD and the NASDAQ 100 remains negative.

NVIDIA reported another strong earnings beat, topping both revenue and earnings expectations. However, unlike some prior quarters, markets did not rally meaningfully. Investor skepticism toward software valuations and AI-related capital expenditures continues despite solid earnings growth and ongoing infrastructure investment.

Inflation concerns resurfaced. January PPI rose 0.5%, above expectations, adding uncertainty to the Fed’s rate outlook. At the same time, Treasury yields declined during the week, with the 10Y dipping below 4% for the first time since November, supporting fixed income returns. As 2022 rolls out of three-year return calculations, core bonds are now up more than 5% annualized over the past three years. 

This Week

It is the first week of March, which brings both private and public labor market data. ADP employment and Nonfarm Payrolls will take center stage. Expectations are for 54,000 jobs added in February and an unchanged unemployment rate of 4.3%. Markets will weigh employment resilience against renewed inflation pressures to reassess the likelihood of Fed action later this year.

Geopolitics will remain in focus as tensions between the U.S., Israel, and Iran continue. Oil prices, energy stocks, and safe haven flows will be closely watched for signs of broader economic impact.

Earnings season continues with reports from Broadcom, CrowdStrike, Costco, and Target. With AI leadership being questioned and software under pressure, results from technology and consumer-facing companies could influence near-term market direction. 

We hope you have a great week. If there’s anything we can do to help you, please feel free to reach out to ben.vaske@orion.com or opsresearch@orion.com.
 

Get Your Own Market Commentary

Client-Friendly Weekly Wire

Want a version of Weekly Wire you can send directly to your clients? Subscribe to our Weekly Wire newsletter and get a client-friendly version every Monday. Simply download, add your firm's logo, and use with your clients!


Key Data

Stocks, Bonds, Alternatives, and Real Assets as of February 27, 2026

Security Name

Risk Score

1 Wk

1 Mo

QTD

YTD

1 Yr

3 Yr Ann.

Global Equities (60% US, 40% Intl)

100

0.44%

0.96%

0.96%

0.96%

27.02%

20.92%

S&P 500 Total Return

102

-0.42%

-0.76%

-0.76%

-0.76%

16.99%

21.80%

Dow Jones Industrial Average

97

-1.28%

0.31%

0.31%

0.31%

13.59%

16.61%

NASDAQ 100 Total Return

122

-0.20%

-2.26%

-1.06%

-1.06%

20.35%

28.48%

TV Benchmark

107

-0.63%

-0.90%

0.58%

0.58%

16.97%

22.30%

Morningstar US Large Cap

102

-0.67%

-2.20%

-1.38%

-1.38%

16.67%

23.69%

Morningstar US Mid Cap

113

0.39%

3.87%

7.04%

7.04%

15.51%

14.42%

Morningstar US Small Cap

125

-0.90%

2.43%

6.42%

6.42%

19.58%

13.63%

Morningstar US Value

98

-0.11%

3.27%

7.32%

7.32%

18.22%

16.56%

Morningstar US Growth

126

-0.86%

-1.29%

-0.13%

-0.13%

15.01%

20.98%

MSCI ACWI Ex USA

98

1.75%

5.04%

11.33%

11.33%

40.46%

20.53%

MSCI EAFE

101

1.24%

4.64%

10.11%

10.11%

35.31%

19.38%

MSCI EM

98

2.83%

5.51%

14.86%

14.86%

50.83%

22.14%

Bloomberg US Agg Bond Index

27

0.54%

1.64%

1.75%

1.75%

6.26%

5.12%

Bloomberg High Yield Corp Bond Index

41

-0.22%

0.19%

0.69%

0.69%

7.18%

9.42%

Bloomberg Commodity Index

70

1.74%

1.10%

11.58%

11.58%

23.30%

9.75%

Wilshire Liquid Alternative Index

25

0.18%

0.83%

1.85%

1.85%

7.82%

6.36%

MSCI US REIT

104

1.01%

7.90%

11.22%

11.22%

9.27%

10.37%

US Dollar

10

-0.14%

0.77%

-0.54%

-0.54%

-8.10%

-2.41%

Bloomberg US Treasury Bill 1-3mo

1

0.07%

0.28%

0.58%

0.58%

4.17%

4.88%

Source: Morningstar

The TV Benchmark represents an average of the S&P 500, Dow Jones IA, and NASDAQ 100 return indexes. The Orion Risk Score represents risk relative to the global equity market.


Interest Rates as of February 27, 2026

Rate

This Week

1 Wk Δ%

13-Wk Treasury Yield

3.58%

-0.02%

10-Yr Treasury Yield

3.96%

-0.12%

Bloomberg US Agg Yield

4.18%

-0.07%

Avg Money Mkt Yield

3.49%

-0.01%

Avg 30-Yr Mortgage Rate

6.15%

-0.01%

Sources: Yahoo Finance, S&P Global, Crane Data, BankRate


Key Economic Data Last Week

Data Point

Expectation

Actual

Wholesale Inventories - Dec

0.2%

0.2%

Consumer Confidence - Feb

88.6

91.2

Producer Price Index (PPI) YoY - Jan

--

2.9%

Core PPI YoY - Jan

--

3.4%

Source: MarketWatch


Key Economic Data This Week

Data Point

Expectation

Release Date

ISM Manufacturing - Feb

52.0%

3/2/26

ADP Employment - Feb

50,000

3/4/26

ISM Services - Feb

53.5%

3/4/26

U.S. Productivity - Q4

1.8%

3/5/26

U.S. Employment Report - Feb

54,000

3/6/26

U.S. Unemployment Rate - Feb

4.3%

3/6/26

Source: MarketWatch

 
More Just for You

Want Resources for Your Clients?

Get a version of Weekly Wire you can send directly to your clients. Subscribe to our Weekly Wire newsletter and get a client-friendly version every Monday. Simply download, add your firm's logo, and use with your clients!

The views expressed herein are exclusively those of Orion Portfolio Solutions, LLC d/b/a Brinker Capital Investments, a registered Investment Advisor, and are not meant as investment advice and are subject to change. Information contained herein is derived from sources we believe to be reliable, however, we do not represent that this information is complete or accurate and it should not be relied upon as such. This information is prepared for general information only. It does not have regard to the specific investment objectives, financial situation, and the particular needs of any specific person.

An index is an unmanaged group of assets considered to be representative of a select segment or segments of the market in general, as determined by the index manager for the purposes of managing a specific index. You cannot invest directly in an index.

The CFA® is a globally respected, graduate-level investment credential established in 1962 and awarded by CFA Institute — the largest global association of investment professionals. To learn more about the CFA charter, visit www.cfainstitute.org.

Think2perform’s Behavioral Financial Advice program integrates traditional finance practices with psychology and neuroscience to improve emotional competency and decision-making behavior that increases effective usage of the financial plan with clients. To obtain the Behavioral Financial Advisor (BFA) designation, participants must complete a self-directed course, which takes 20-30 hours to complete, and includes a mix of interactive exercises, videos and case studies. To learn more about the BFA, visit https://www.think2perform.com.

Wealth management services provided by Orion Portfolio Solutions, LLC (“OPS”), a registered investment advisor. Orion OCIO services provided by TownSquare Capital, LLC (“TSC”), a registered investment advisors. OPS and TSC are affiliates and wholly owned subsidiaries of Orion Advisor Solutions, Inc.