Weekly Notes from Tim

By Tim Holland, CFA, Chief Investment Officer

  • More than a few investors have wondered how – in the face of so much geo-political and policy uncertainty – US equities, at least as measured by the S&P 500 and the NASDAQ Composite, could be sitting at all-time highs, up 8% and 9%, respectively, year to date, as of July 23rd. Well, at the risk of really oversimplifying things, we think that it’s because of us, we the US consumer – the most powerful economic force on this big, blue marble we call home.    
     
  • Consider that the US economy is 70% consumption driven, so more than anything it is the eclairs, electronics and Espadrilles (for those who remember the 1980s and Miami Vice) we buy – or decide not to buy – that propel the economy forward or hold it back. And as of now, despite the headwinds the US economy has faced in 2025 and continues to face as we move deeper into the second half, the US consumer is hanging in there, with arguably the most important pillar of support for spending being a still solid jobs market, marked by a 4.1% unemployment rate; a bit more than one job opening for every American seeking employment, and 150,000 jobs created in June.  
     
  • As it concerns what corporate America thinks of us, when several big banks reported quarterly earnings results two weeks ago, they had generally good things to say about how we were doing, and why that was a good thing for their lending and credit card businesses (see the quote below from JP Morgan). Finally, the US consumer, particularly those in the middle-income cohort and above, are getting a big financial boost from what is essentially record Household Net Worth of $160 trillion dollars, itself pushed up by record high stock and home prices (see the chart below). For now, the US consumer is doing okay, and if the US consumer is doing okay, the US economy should be okay, and if the US economy is okay, corporate profits should be okay and if corporate profits are okay, US stocks should be too.  
     
Picture 1

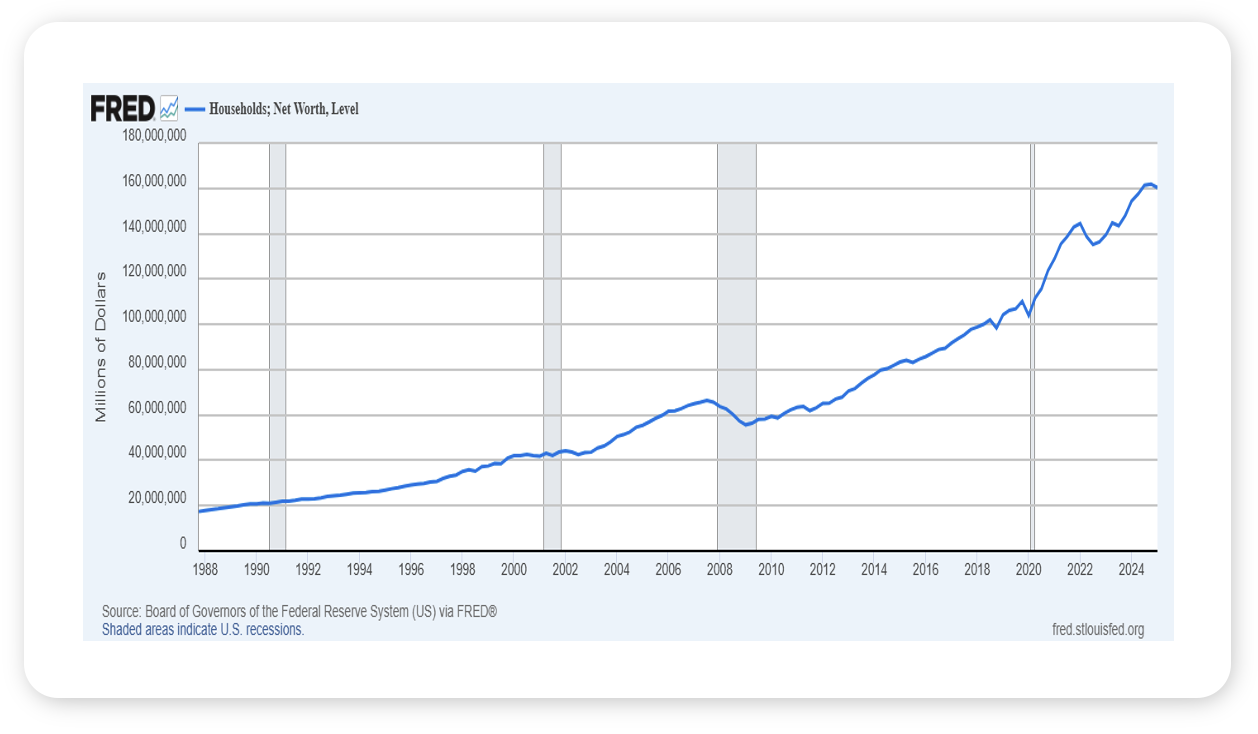
Source: : Federal Reserve Bank of St. Louis, July 2025 


Picture 2

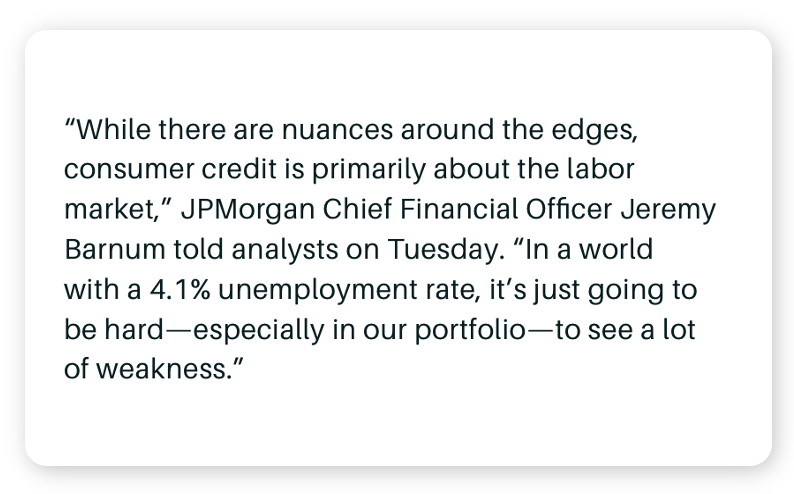
Source: Barron’s, July 21, 2025  


Looking Back, Looking Ahead

By Ben Vaske, BFA, Manager, Investment Strategy

Last Week

Markets climbed again last week, with the S&P 500 gaining about 1.5% and developed international equities rising around 2%. The advance adds to what’s been a strong summer stretch, led by continued strength from tech, international momentum, and signs of easing trade tensions. The US dollar and broad commodities each lost over 1%, with the dollar returning to a double-digit decline year-to-date.

Over the weekend, the US and China agreed to extend their tariff truce another 90 days, and President Trump announced that a trade deal had been reached with the European Union. Throughout 2025, tariff pauses have generally acted as tailwinds for equity markets.

Economic data was mixed. Existing home sales declined 2.7% in June to a nine-month low, held back by persistently high prices despite improving inventory. New home sales rose 0.6% but missed expectations and remain down 6.6% from a year ago. Durable goods orders fell 9.3% in June, worse than expectations, driven largely by a sharp pullback in commercial aircraft orders, which had spiked earlier in the year. Leading indicators declined again, reinforcing the slow-drift narrative we've seen in recent months.

Q2 earnings are off to a strong start. According to FactSet, 34% of S&P 500 companies have reported results, with 80% beating EPS and revenue estimates. The blended earnings growth rate now stands at 6.4%, up from 4.9% at the start of earnings season. This would mark the lowest earnings growth since Q1 2024 but still reflects an improving picture. 
 

This Week

This week brings one of the most data-heavy calendars of the year. We'll see official Q2 GDP (expected at 2.4% per Atlanta Fed), the Fed’s interest rate decision, PCE inflation data, and the July nonfarm payrolls report. The Fed is widely expected to hold rates steady at their interest rate decision meeting on Wednesday, with CME FedWatch showing a 98% probability of no change. Markets still expect two cuts by year-end, though that outlook continues to drift.

It’s also the busiest week for Q2 earnings, with more than 30% of S&P 500 companies reporting. Highlights include Microsoft, Meta, Amazon, and Apple. 


We hope you have a great week. If there’s anything we can do to help you, please feel free to reach out to ben.vaske@orion.com or opsresearch@orion.com.
 

Get Your Own Market Commentary

Client-Friendly Weekly Wire

Want a version of Weekly Wire you can send directly to your clients? Subscribe to our Weekly Wire newsletter and get a client-friendly version every Monday. Simply download, add your firm's logo, and use with your clients!


Key Data

Stocks, Bonds, Alternatives, and Real Assets as of July 25, 2025

Security Name

Risk Score

1 Wk

1 Mo

QTD

YTD

1 Yr

3 Yr Ann.

Global Equities (60% US, 40% Intl)

100

1.43%

4.46%

2.65%

13.87%

20.12%

17.22%

S&P 500 Total Return

102

1.47%

4.95%

3.03%

9.42%

19.92%

19.00%

Dow Jones Industrial Average

97

1.28%

4.55%

1.91%

6.55%

14.41%

14.20%

NASDAQ 100 Total Return

122

0.90%

4.68%

2.64%

11.20%

24.53%

24.62%

TV Benchmark

107

1.22%

4.73%

2.53%

9.06%

19.62%

19.27%

Morningstar US Large Cap

102

1.37%

4.87%

2.89%

9.75%

21.25%

20.77%

Morningstar US Mid Cap

113

1.60%

5.37%

3.37%

8.76%

17.26%

13.40%

Morningstar US Small Cap

125

1.23%

5.53%

3.90%

4.69%

8.95%

11.04%

Morningstar US Value

98

1.46%

3.62%

1.99%

7.94%

10.83%

12.81%

Morningstar US Growth

126

1.00%

4.87%

2.78%

11.42%

25.57%

19.59%

MSCI ACWI Ex USA

98

1.47%

3.53%

1.97%

20.64%

20.31%

14.79%

MSCI EAFE

101

1.93%

3.52%

1.41%

21.61%

19.38%

16.13%

MSCI EM

98

0.71%

3.46%

3.17%

19.23%

20.44%

11.72%

Bloomberg US Agg Bond Index

27

0.37%

0.01%

-0.40%

3.60%

4.49%

1.90%

Bloomberg High Yield Corp Bond Index

41

0.35%

0.98%

0.48%

5.07%

9.12%

8.53%

Bloomberg Commodity Index

70

-1.48%

1.59%

1.72%

7.35%

11.83%

0.36%

Wilshire Liquid Alternative Index

25

0.38%

1.06%

0.43%

3.15%

3.88%

4.30%

US Dollar

10

-1.37%

-0.49%

0.52%

-10.24%

-6.72%

3.01%

Bloomberg US Treasury Bill 1-3mo

1

0.08%

0.38%

0.32%

2.46%

4.71%

4.75%

Source: Morningstar

The TV Benchmark represents an average of the S&P 500, Dow Jones IA, and NASDAQ 100 return indexes. The Orion Risk Score represents risk relative to the global equity market.


Interest Rates as of July 25, 2025

Rate

This Week

1 Wk Δ%

13-Wk Treasury Yield

4.25%

0.02%

10-Yr Treasury Yield

4.39%

-0.04%

Bloomberg US Agg Yield

4.70%

0.00%

Avg Money Mkt Yield

4.11%

0.00%

Avg 30-Yr Mortgage Rate

6.79%

0.04%

Sources: Yahoo Finance, S&P Global, Crane Data, BankRate


Key Economic Data Last Week

Data Point

Expectation

Actual

U.S. Leading Economic Indicators

-0.2%

-0.3%

Existing Home Sales

4.0M

3.93M

S&P Flash U.S. Services PMI

53.2

55.2

S&P Flash U.S. Manufacturing PMI

52.4

49.5

New Home Sales

650,000

627,000

Durable Goods Orders

-11.1%

(9.3%)

Source: MarketWatch


Key Economic Data This Week

Data Point

Expectation

Release Date

Consumer Confidence

96.0

7/29/25

Job Openings

7.4M

7/29/25

ADP Employment 

82,000

7/30/25

Q2 GDP

2.3%

7/30/25

Federal Reserve Interest Rate Decision

Pause

7/30/25

Personal Consumption Expenditures (PCE) YoY

2.5%

7/31/25

Core PCE YoY

2.7%

7/31/25

US Unemployment Rate

4.2%

8/1/25

Nonfarm Payrolls

102,000

8/1/25

ISM Manufacturing

49.5%

8/1/25

Source: MarketWatch

 
More Just for You

Want Resources for Your Clients?

Get a version of Weekly Wire you can send directly to your clients. Subscribe to our Weekly Wire newsletter and get a client-friendly version every Monday. Simply download, add your firm's logo, and use with your clients!

The views expressed herein are exclusively those of Orion Portfolio Solutions, LLC d/b/a Brinker Capital Investments, a registered Investment Advisor, and are not meant as investment advice and are subject to change. Information contained herein is derived from sources we believe to be reliable, however, we do not represent that this information is complete or accurate and it should not be relied upon as such. This information is prepared for general information only. It does not have regard to the specific investment objectives, financial situation, and the particular needs of any specific person.

An index is an unmanaged group of assets considered to be representative of a select segment or segments of the market in general, as determined by the index manager for the purposes of managing a specific index. You cannot invest directly in an index.

The CFA® is a globally respected, graduate-level investment credential established in 1962 and awarded by CFA Institute — the largest global association of investment professionals. To learn more about the CFA charter, visit www.cfainstitute.org.

Think2perform’s Behavioral Financial Advice program integrates traditional finance practices with psychology and neuroscience to improve emotional competency and decision-making behavior that increases effective usage of the financial plan with clients. To obtain the Behavioral Financial Advisor (BFA) designation, participants must complete a self-directed course, which takes 20-30 hours to complete, and includes a mix of interactive exercises, videos and case studies. To learn more about the BFA, visit https://www.think2perform.com.

Wealth Management services offered through Orion Portfolio Solutions, LLC d/b/a Brinker Capital Investments a registered investment advisor.