
-
Advisor Tech
-
-
Recommended
-
-
Wealth Management
-
-
Recommended
-
-
Who We Serve
-
-
IndividualsFirms
Recommended
- Resources
-
-
LearnEngageConnect
Recommended

Our investment team is closely monitoring the developments in the Middle East and the impact they are having on commodity prices, the stock market, and the world economy. We lament the loss of innocent life, pray for the safety of U.S. troops in harm’s way and mourn the U.S. military servicemembers who have lost their lives.
You will continue to hear from us on the conflict with Iran. In the meantime, if you have any questions on the markets and the economy or if there is anything we can do to support you and your clients during this difficult time, please reach out to us via our Investment Strategy Team’s email address at opsresearch@orion.com.
Weekly Notes from Tim
By Tim Holland, CFA, Chief Investment Officer
- We usually write about the economy, markets and policy in the Weekly Wire and not about companies, which makes sense as the Orion Investment Team focuses on macro and market analysis and asset allocation and portfolio construction, and not on the merits of specific stocks, at least not from a fundamental or bottom-up perspective (we do manage a suite of quantitatively constructed equity portfolios). However, given the news around NVIDIA and its share price performance, we thought we should take pen to paper on what was until recently the world’s most valuable company.
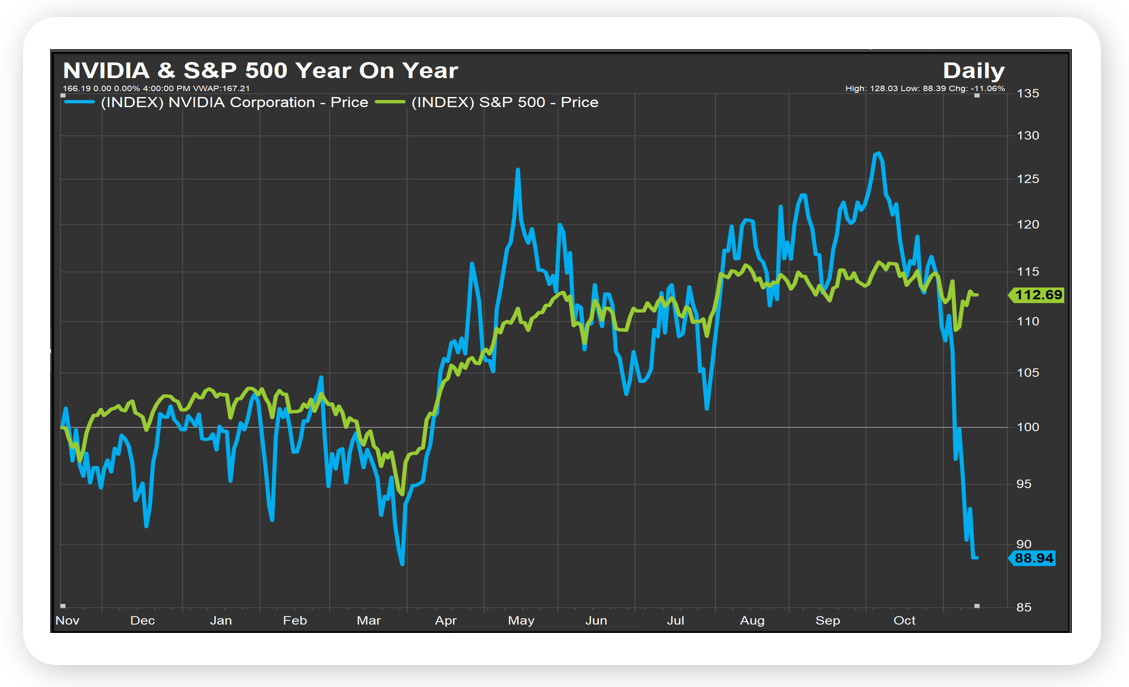
- NVIDIA makes the specialized microprocessors and supercomputing systems that tech companies use to train and run AI models and has been key to the commercialization of Artificial Intelligence; it has also produced extraordinary financial results and share price performance. Consider that NVIDIA grew sales and income from $27 billion and $10 billion in the fiscal year ending 1/31/2022 to an estimated $412 billion and $244 billion in the fiscal year ending 1/31/2027 while its stock returned 1,338% from late November 2022 through an early October all-time high of $243. More recently, NVIDIA and its share price have come under intense pressure, initially as investors questioned the durability of the AI cap ex cycle post mid-terms, then on news of co-founder and CEO Jensen Huang’s resignation.
- While we are writing about NVIDIA this week, we won’t offer an opinion on the outlook for the company and the share price – though from a timing point of view it is interesting that NVIDIA will report quarterly financial results tomorrow. We are also not ignoring what the drawdown has meant for investors (at its peak, Nvidia made up 8% of the S&P 500, so anyone with broad US equity exposure has been impacted). We do want to note that the S&P 500 has held up remarkably well in the face of the stock’s pullback, off marginally the past month and up nicely year on year (see chart).
- The past few days have reminded us that we don’t invest in a stock market, but a market of stocks, with each company pushed along or held back by factors and circumstances unique to them. We’ve also been reminded of the resiliency of US risk assets and the US economy, and we remain optimistic on both.
Source: FactSet, November 2026
Looking Back, Looking AheadBy Ben Vaske, CFA, Manager, Investment Strategy
Last Week
The S&P 500 broadly rebounded from its worst week since Liberation Day as oil prices fell Monday, easing inflation fears, and the selloff was widely viewed as overdone. The NASDAQ 100 gained approximately 3.5%, the S&P 500 approximately 2.5%, and the Dow just over 2%, while small caps added roughly 1.5% and growth slightly outpaced value. International markets participated, with emerging markets up just over 3% and developed markets up about 2%, even as the U.S. dollar strengthened roughly 1.6%. Fixed income was the weak spot, with the Bloomberg Agg down about 1.5% as rates shot higher once again. Despite the bounce, the NASDAQ 100 is still down about 8.5% over the past month and roughly 8% for the quarter, while value is up over 6% for the quarter and over 26% year-to-date.
October CPI came in slightly above expectations at 0.4%, putting the year-over-year rate at an estimated 4.1%, with PPI up 6.5% from a year ago, its highest reading in almost four years. The cumulative picture matters as much as the annual rate: prices are now about 30% higher than in early 2020, a gap that will not close even if inflation cools. Futures now price a 100% probability of at least one hike at the December 9th meeting. On the corporate front, NVIDIA founder and CEO Jensen Huang resigned Thursday, with CFO Colette Kress named interim CEO while the board searches for a permanent replacement.
This Week
Anthropic is expected to price its IPO Wednesday and begin trading Thursday under the ticker “ANT,” at an estimated $70 to $78 per share, making it the second $1 trillion plus IPO in history and one that arrives ahead of OpenAI. NVIDIA reports Tuesday after the close, just days after Huang’s resignation, with the stock down about 6% last week and about 33% from its all-time high. On the economic calendar, retail sales arrive Tuesday and housing starts Wednesday, with the housing market drawing attention amid fresh mortgage rate pressure and a weak existing home sales report. Presidents Trump, Xi, and Putin are also expected to hold an unprecedented trilateral meeting on nuclear non-proliferation this week. Q3 earnings season is nearly complete, with blended growth at 31.9%, which would mark a third straight quarter above 25%.
Get Your Own Market CommentaryClient-Friendly Weekly Wire
Want a version of Weekly Wire you can send directly to your clients? Subscribe to our Weekly Wire newsletter and get a client-friendly version every Monday. Simply download, add your firm's logo, and use with your clients!
Key Data
Stocks, Bonds, Alternatives, and Real Assets as of November 13 2026
Security Name
Risk Score
1 Wk
1 Mo
QTD
YTD
1 Yr
3 Yr Ann.
Global Equities (60% US, 40% Intl)
100
2.41%
-2.57%
-1.63%
11.36%
13.62%
20.42%
S&P 500 Total Return
101
2.54%
-3.05%
-1.07%
11.54%
13.55%
21.23%
Dow Jones Industrial Average
91
2.13%
1.40%
2.96%
10.36%
12.11%
17.12%
NASDAQ 100 Total Return
122
3.55%
-8.56%
-8.06%
11.25%
12.52%
22.64%
TV Benchmark
105
2.74%
-3.40%
-2.06%
11.05%
12.73%
20.33%
Russell 1000 TR USD
102
2.53%
-2.81%
-0.77%
11.43%
13.44%
21.11%
Russell Mid Cap TR USD
103
2.51%
0.86%
3.60%
15.87%
18.12%
19.08%
Russell 2000 TR USD
127
1.36%
0.34%
-0.13%
13.57%
18.55%
19.42%
Russell 3000 Growth TR USD
124
2.79%
-9.21%
-7.98%
-2.12%
-1.01%
18.38%
Russell 3000 Value TR USD
89
2.23%
3.39%
6.07%
26.45%
30.18%
22.84%
MSCI ACWI Ex USA
100
2.26%
-1.80%
-3.07%
11.14%
12.86%
19.96%
MSCI EAFE
96
2.07%
0.58%
-0.53%
10.22%
11.97%
18.86%
MSCI EM
118
3.21%
-6.56%
-8.95%
12.65%
12.57%
20.83%
Bloomberg US Agg Bond Index
27
-1.50%
0.68%
1.31%
-1.64%
-1.12%
4.36%
Bloomberg High Yield Corp Bond Index
34
-0.26%
0.25%
0.44%
0.54%
1.89%
7.83%
Bloomberg Commodity Index
40
-0.89%
-7.55%
-5.40%
25.69%
25.72%
13.88%
Wilshire Liquid Alternatives
26
0.49%
-0.75%
-0.15%
3.62%
4.83%
6.41%
MSCI US REIT
95
0.79%
5.45%
6.18%
17.25%
17.06%
15.91%
US Dollar
10
1.60%
0.57%
1.70%
4.93%
3.70%
-0.85%
Bloomberg US Treasury Bill 1-3mo
1
0.07%
0.36%
0.51%
3.28%
3.82%
4.54%
Source: Morningstar
The TV Benchmark represents an average of the S&P 500, Dow Jones IA, and NASDAQ 100 return indexes. The Orion Risk Score represents risk relative to the global equity market.
Interest Rates as of November 13, 2026
Rate
This Week
1 Wk Δ%
13-Wk Treasury Yield
4.12%
0.12%
10-Yr Treasury Yield
5.15%
0.29%
Bloomberg US Agg Yield
5.44%
0.28%
Avg Money Mkt Yield
3.74%
-0.01%
Avg 30-Yr Mortgage Rate
7.28%
0.08%
Sources: Yahoo Finance, S&P Global, Crane Data, BankRate
Key Economic Data Last Week
Data Point
Expectation
Actual
Consumer Price Index (CPI) MoM
0.3%
0.4%
Core CPI MoM
0.2%
0.3%
Existing Home Sales
3.8M
3.8M
Producer Price Index (PPI) YoY
6.6%
6.5%
Source: MarketWatch
Key Economic Data This Week
Data Point
Expectation
Release Date
Retail Sales
0.2%
11/17/2026
Housing Starts
1.3M
11/18/2026
Leading Indicators Index
0.1%
11/19/2026
U. Michigan Final Consumer Survey
52.2
11/20/2026
Source: MarketWatch
More Just for YouWant Resources for Your Clients?
Get a version of Weekly Wire you can send directly to your clients. Subscribe to our Weekly Wire newsletter and get a client-friendly version every Monday. Simply download, add your firm's logo, and use with your clients!
The views expressed herein are exclusively those of Orion Portfolio Solutions, LLC d/b/a Brinker Capital Investments, a registered Investment Advisor, and are not meant as investment advice and are subject to change. Information contained herein is derived from sources we believe to be reliable, however, we do not represent that this information is complete or accurate and it should not be relied upon as such. This information is prepared for general information only. It does not have regard to the specific investment objectives, financial situation, and the particular needs of any specific person.
An index is an unmanaged group of assets considered to be representative of a select segment or segments of the market in general, as determined by the index manager for the purposes of managing a specific index. You cannot invest directly in an index.
The CFA® is a globally respected, graduate-level investment credential established in 1962 and awarded by CFA Institute — the largest global association of investment professionals. To learn more about the CFA charter, visit www.cfainstitute.org.
Wealth management services provided by Orion Portfolio Solutions, LLC (“OPS”), a registered investment advisor. Orion OCIO services provided by TownSquare Capital, LLC (“TSC”), a registered investment advisor. OPS and TSC are affiliates and wholly owned subsidiaries of Orion Advisor Solutions, Inc.
The S&P 500 Index is an unmanaged composite of 500-large capitalization companies. This index is widely used by professional investors as a performance benchmark for large-cap stocks.
The Nasdaq 100 Index is a market index that includes 100 of the largest nonfinancial companies listed on the Nasdaq stock exchange, representing diverse sectors like technology and healthcare.
The Bloomberg Barclays US Aggregate Bond Index measures the performance of the total United States investment-grade bond market.
The Nasdaq Composite Index is an index that follows approximately 5000 stocks that trade on the Nasdaq exchange. It is considered a good benchmark for smaller company stocks.
The Dow Jones Industrial Average (DJIA) is a price weighted index of 30 of the largest, most widely held stocks traded on the New York Stock Exchange.
-
-
-