Weekly Notes from Tim

By Tim Holland, CFA, Chief Investment Officer

  • We Americans love our cars – actually, we love our cars and trucks, as the Ford F-150 was the best-selling vehicle in the US from 1977 to 2024. And as a nation of drivers, we are a nation attuned to the price of gas, and the price we pay at the pump has a big impact on how we feel about our economy and our expectations for inflation and, for economists, inflation expectations are a big deal as many believe they are a self-fulfilling phenomena – if folks expect prices to head lower, they will behave in a way that helps push prices lower, and if folks expect prices to head higher they will behave in a way that helps push prices higher.
     
  • And inflation remains an incredibly important topic as the Fed renews its rate cutting campaign – the Fed cut rates a quarter point at its September meeting, and Wall Street expects quarter point cuts at its October and December meetings – and if there is one thing that could scuttle those expected rate cuts it's an unexpected spike in inflation (and the Fed doesn’t have a ton of wiggle room on that front, as inflation has remained above its long-term target of 2%).
     
  • Which brings us to the point of this week’s note, and a bit of good news for the American consumer, and a bit of good news in the ongoing inflation fight, and that is the price of gasoline. As measured by the NY Harbor RBOB Futures Contract, the price of gasoline is near a five-year low, recently changing hands at $1.79 on October 17th (see chart, far right; the price is slightly higher as we take pen to paper on news of US sanctions on Russian oil companies), well off its 30-year high of $4.33 hit in June of 2022 (see chart, far left). We should stop and consider that for a second – the price of gas hit a 30-year high three years ago. Now, the NY Harbor RBOB Futures Contract doesn’t fully reflect the price we pay at the pump – that will be higher due to additives, taxes and other factors – but it lets us know where gasoline prices have been and are likely headed, and they have headed down, a development which should put more money back into Americans’ pockets and should put downward pressure on inflation and inflation expectations, good news for our consumer driven economy and good news for a rate cutting Fed.
     
Picture 1

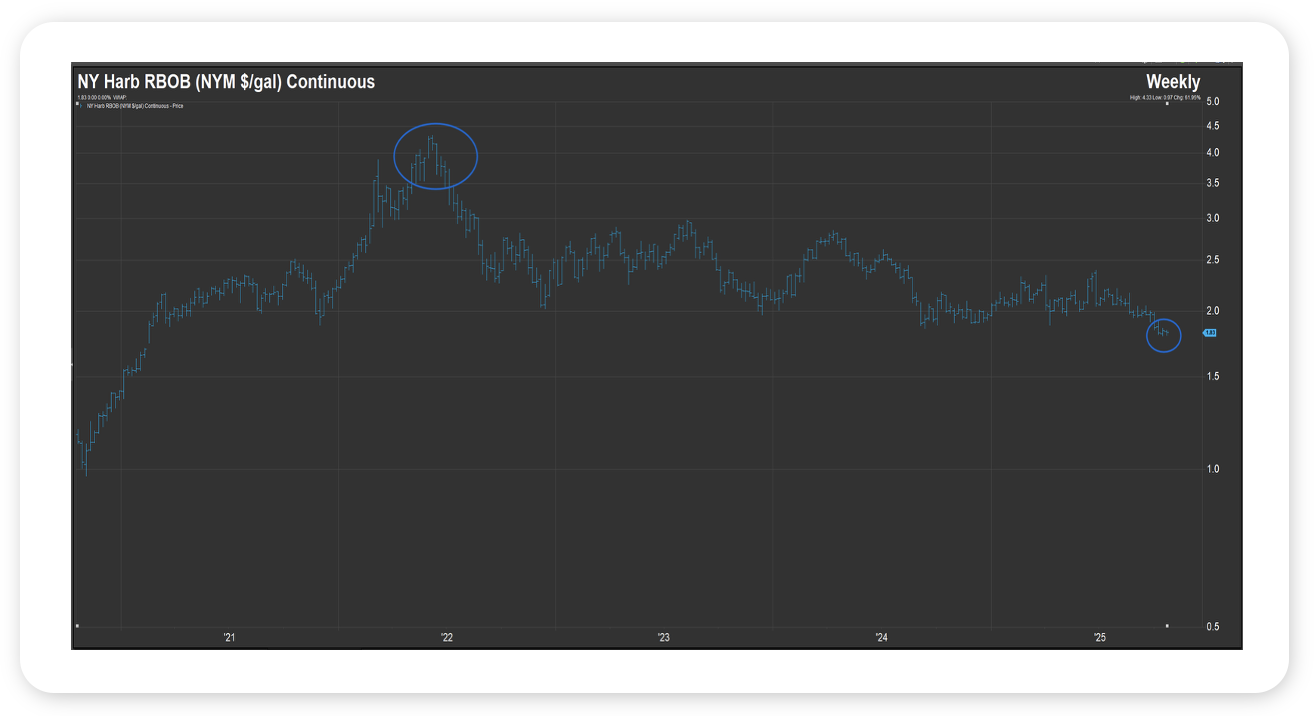
Source: FactSet, October 2025  


Looking Back, Looking Ahead

By Ben Vaske, BFA, Manager, Investment Strategy

Last Week

Markets advanced again last week, with the S&P 500 closing at a new all-time high (its 34th of the year) after coming close to a bear market in April. Small caps and growth stocks led gains on the week, bolstering global equities to about a 2% gain. The balanced 60/40 mix of U.S. and international equities is now up more than 21% year-to-date.

September’s CPI report, which was delayed by the government shutdown, came in below expectations at 3.0% year-over-year. However, this was the highest inflation reading in several years. The softer-than-expected CPI print helped drive Friday’s rally and supported expectations for additional rate cuts by year-end.

Over the weekend, the U.S. and China reached an initial trade framework to ease recent tensions. The agreement included China’s delay of rare earth export restrictions and a commitment to purchase more U.S. soybeans, marking a notable de-escalation following renewed tariff threats in recent weeks.

Internationally, emerging markets continued to outperform developed peers and remain the leading equity region in 2025, up over 32% year-to-date. On the fixed income side, Treasury yields declined slightly, led by the short end of the curve. 
 

This Week

This week brings several market-moving catalysts. Nearly half of S&P 500 companies are set to report earnings, including five of the “Magnificent 7.” Consensus expects Q3 earnings growth of 9.2%, which would mark the ninth straight quarter of gains.

The Federal Reserve will announce its October policy decision on Wednesday, with markets pricing a 97% chance of a 25 bp rate cut. GDP and PCE reports are also scheduled for release but may be delayed if the government shutdown continues.
 

We hope you have a great week. If there’s anything we can do to help you, please feel free to reach out to ben.vaske@orion.com or opsresearch@orion.com.
 

Get Your Own Market Commentary

Client-Friendly Weekly Wire

Want a version of Weekly Wire you can send directly to your clients? Subscribe to our Weekly Wire newsletter and get a client-friendly version every Monday. Simply download, add your firm's logo, and use with your clients!


Key Data

Stocks, Bonds, Alternatives, and Real Assets as of October 24, 2025

Security Name

Risk Score

1 Wk

1 Mo

QTD

YTD

1 Yr

3 Yr Ann.

Global Equities (60% US, 40% Intl)

100

1.79%

2.36%

1.77%

21.51%

20.84%

22.44%

S&P 500 Total Return

102

1.93%

2.39%

1.61%

16.68%

18.43%

23.19%

Dow Jones Industrial Average

97

2.24%

2.44%

1.82%

12.49%

13.32%

16.67%

NASDAQ 100 Total Return

122

2.18%

3.51%

2.77%

21.37%

26.25%

31.49%

TV Benchmark

107

2.11%

2.78%

2.07%

16.85%

19.33%

23.78%

Morningstar US Large Cap

102

1.96%

2.56%

1.87%

18.44%

21.03%

25.45%

Morningstar US Mid Cap

113

1.86%

1.31%

0.49%

10.67%

10.67%

16.05%

Morningstar US Small Cap

125

2.37%

2.11%

1.77%

10.72%

10.98%

15.07%

Morningstar US Value

98

1.55%

1.81%

1.01%

13.70%

10.45%

15.29%

Morningstar US Growth

126

2.11%

2.39%

1.51%

17.62%

22.65%

25.43%

MSCI ACWI Ex USA

98

1.50%

2.50%

2.03%

29.21%

24.03%

21.76%

MSCI EAFE

101

1.25%

2.53%

1.65%

27.79%

22.82%

21.85%

MSCI EM

98

2.05%

2.85%

3.27%

32.41%

25.89%

21.62%

Bloomberg US Agg Bond Index

27

0.17%

1.27%

1.20%

7.41%

6.39%

6.27%

Bloomberg High Yield Corp Bond Index

41

0.40%

0.14%

0.24%

7.48%

8.24%

10.86%

Bloomberg Commodity Index

70

1.74%

3.56%

2.89%

12.54%

12.27%

3.61%

Wilshire Liquid Alternative Index

25

0.48%

0.75%

0.63%

6.34%

5.01%

6.01%

US Dollar

10

0.61%

1.72%

1.19%

-8.80%

-5.26%

-4.05%

Bloomberg US Treasury Bill 1-3mo

1

0.08%

0.35%

0.29%

3.54%

4.46%

4.91%

Source: Morningstar

The TV Benchmark represents an average of the S&P 500, Dow Jones IA, and NASDAQ 100 return indexes. The Orion Risk Score represents risk relative to the global equity market.


Interest Rates as of October 24, 2025

Rate

This Week

1 Wk Δ%

13-Wk Treasury Yield

3.76%

-0.07%

10-Yr Treasury Yield

4.00%

-0.01%

Bloomberg US Agg Yield

4.26%

0.00%

Avg Money Mkt Yield

3.92%

0.01%

Avg 30-Yr Mortgage Rate

6.31%

-0.05%

Sources: Yahoo Finance, S&P Global, Crane Data, BankRate


Key Economic Data Last Week

Data Point

Expectation

Actual

U.S. Leading Economic Indicators

-0.3%

DELAYED

Existing Home Sales

4.06M

4.06M

Consumer Price Index (CPI) YoY

3.1%

3.0%

Core CPI YoY

3.1%

3.0%

Consumer Sentiment

54.9

53.6

*New Home Sales

710,000

DELAYED

Source: MarketWatch


Key Economic Data This Week

Data Point

Expectation

Release Date

Consumer Confidence

94.0

10/29/25

*Q3 Gross Domestic Product (GDP)

2.8%

10/30/25

*Personal Consumption Expenditures (PCE) YoY

--

10/31/25

Core PCE YoY

--

10/31/25

Source: MarketWatch

 
More Just for You

Want Resources for Your Clients?

Get a version of Weekly Wire you can send directly to your clients. Subscribe to our Weekly Wire newsletter and get a client-friendly version every Monday. Simply download, add your firm's logo, and use with your clients!

The views expressed herein are exclusively those of Orion Portfolio Solutions, LLC d/b/a Brinker Capital Investments, a registered Investment Advisor, and are not meant as investment advice and are subject to change. Information contained herein is derived from sources we believe to be reliable, however, we do not represent that this information is complete or accurate and it should not be relied upon as such. This information is prepared for general information only. It does not have regard to the specific investment objectives, financial situation, and the particular needs of any specific person.

An index is an unmanaged group of assets considered to be representative of a select segment or segments of the market in general, as determined by the index manager for the purposes of managing a specific index. You cannot invest directly in an index.

The CFA® is a globally respected, graduate-level investment credential established in 1962 and awarded by CFA Institute — the largest global association of investment professionals. To learn more about the CFA charter, visit www.cfainstitute.org.

Think2perform’s Behavioral Financial Advice program integrates traditional finance practices with psychology and neuroscience to improve emotional competency and decision-making behavior that increases effective usage of the financial plan with clients. To obtain the Behavioral Financial Advisor (BFA) designation, participants must complete a self-directed course, which takes 20-30 hours to complete, and includes a mix of interactive exercises, videos and case studies. To learn more about the BFA, visit https://www.think2perform.com.

Wealth management services provided by Orion Portfolio Solutions, LLC (“OPS”), a registered investment advisor. Orion OCIO services provided by TownSquare Capital, LLC (“TSC”), a registered investment advisors. OPS and TSC are affiliates and wholly owned subsidiaries of Orion Advisor Solutions, Inc.