















Our investment team is closely monitoring the developments in the Middle East and the impact they are having on commodity prices, the stock market, and the world economy. We lament the loss of innocent life, pray for the safety of U.S. troops in harm’s way and mourn the U.S. military servicemembers who have lost their lives. 

You will continue to hear from us on the conflict with Iran. In the meantime, if you have any questions on the markets and the economy or if there is anything we can do to support you and your clients during this difficult time, please reach out to us via our Investment Strategy Team’s email address at opsresearch@orion.com. 

Weekly Notes from Tim

By Tim Holland, CFA, Chief Investment Officer

  • Maybe the most spoken Wall Street adage is “The market hates uncertainty.” And we heard it often on Wednesday, November 4th as US equities rose sharply post election day, which made sense…we had gotten through the mid-terms, the results were definitive and accepted, and investors had a sense of the new political landscape and were ready to move forward. Then, and I am not looking to play politics or pick sides, on Thursday, November 5th Wall Street came to realize that we had replaced uncertainty around the mid-terms with uncertainty around Artificial Intelligence, specifically the outlook for ongoing and expected data center construction, which as we know has been key to the commercialization of the technology, as well as the US economic expansion and US corporate revenue and earnings growth these past few years. And stocks fell sharply, particularly those tied to the AI trade, with the Nasdaq Composite dropping 5.5% and the PHLX Semiconductor Index falling 15.7%. Trillions in US equity market value was wiped away.  
     
  • We have no particular insight into where AI policy is headed as Democrats prepare to take control of Congress and lead Texas and Ohio, though we appreciate the urgency of the question considering Wall Street saw $750 billion+ and $1.5 trillion+ being spent on AI cap ex this year and next. We do think Renaissance Macro’s Head of Policy Steve Pavlick is right when he says the ask of the AI industry will expand, but that the AI cap ex cycle will persist. Said differently, we think the economic tailwind that is AI is not going away. To hear Steve’s perspective on AI and the midterms, watch our November 4 conversation.
     
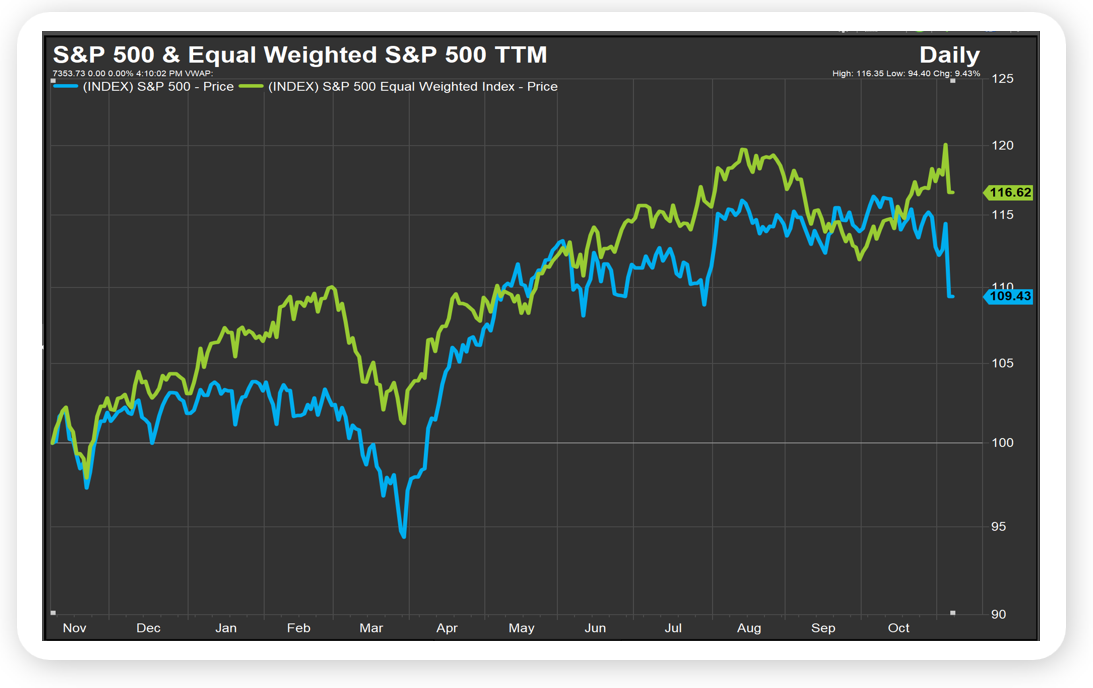
  • Finally, while it has been a very rough run for Wall Street, we take comfort in the performance of the broader market. This has been a bull market led by large cap technology stocks, specifically the Magnificent 7. While the long-term returns from those stocks and their contribution to the return of the market capitalization weighted S&P 500 has been extraordinary, the concern has been given their disproportionate importance to the market were they to falter they would pull the entire market down with them. While that could very well happen, its worth noting on a trailing twelve-month basis that four of the Mag 7 are down, two are positive but have lagged the S&P 500 and just one – Apple – has outperformed the index. To put a finer point on the resiliency of the average stock, the S&P 500 is up 9% over the past year, while the equal weighted S&P 500 is up 16% (see chart). We are not ready to give up on the US bull market just yet.      
     
Picture1


Source: FactSet, November 2026


Looking Back, Looking Ahead

By Ben Vaske, CFA, Manager, Investment Strategy

Last Week

Markets endured a rough week as the tech selloff deepened. The S&P 500 Total Return Index posted its worst weekly return since Liberation Day, and the NASDAQ 100 fell nearly 5% after its worst single day since Liberation Day on Thursday. The index is now down over 13.5% in the past month, officially in correction territory for the third time this year, though it remains up nearly 8% year-to-date. The S&P 500 fell nearly 3%, while the Dow held up better at just under 1%. The rotation away from growth continues, with the Russell 3000 Growth Index now down nearly 5% in 2026 while value is up nearly 24%. International markets also fell, with developed markets down just under 2% and emerging markets down approximately 4%. Bonds and REITs were the relative bright spots, with the Bloomberg Agg and high yield each up about 0.4% and REITs up about 2%, while commodities fell nearly 4.5%. 
 

Last Tuesday’s midterm elections delivered decisive Democratic victories in the House, Senate, and gubernatorial races, outperforming expectations. On the economic front, October nonfarm payrolls beat expectations handily, with 165,000 jobs added against a consensus of 70,000 and prior months revised higher by a combined 84,000. The unemployment rate fell to 4.1%, and the U.S. is now nearing its longest streak in history of unemployment below 5%, currently at 62 months. The strong report pushed December rate hike odds up to 76%. Earnings remain a bright spot, with 88% of companies reported and blended Q3 growth tracking at 31.4%, which would mark a third consecutive quarter above 25%.  


This Week

Inflation takes center stage, with October CPI due Tuesday and PPI on Friday. Ten Fed officials are scheduled to speak, and after Friday’s strong jobs report the group is likely to continue leaning hawkish. On the earnings front, CoreWeave reports Tuesday afternoon, with Cisco and Applied Materials following Thursday, offering an early read on AI infrastructure demand after last week’s selloff. The bond market is closed Wednesday for Veterans Day, while stock markets remain open as normal. 


Get Your Own Market Commentary

Client-Friendly Weekly Wire

Want a version of Weekly Wire you can send directly to your clients? Subscribe to our Weekly Wire newsletter and get a client-friendly version every Monday. Simply download, add your firm's logo, and use with your clients!


Key Data

Stocks, Bonds, Alternatives, and Real Assets as of November 6 2026

Security Name

Risk Score

1 Wk

1 Mo

QTD

YTD

1 Yr

3 Yr Ann.

Global Equities (60% US, 40% Intl)

100

-2.30%

-5.63%

-3.95%

8.74%

11.65%

19.64%

S&P 500 Total Return

101

-2.67%

-5.60%

-3.51%

8.78%

11.05%

20.66%

Dow Jones Industrial Average

91

-0.94%

-0.42%

0.81%

8.06%

11.09%

16.60%

NASDAQ 100 Total Return

122

-4.91%

-13.54%

-11.21%

7.44%

8.09%

22.10%

TV Benchmark

105

-2.84%

-6.52%

-4.64%

8.09%

10.08%

19.79%

Russell 1000 TR USD

102

-2.55%

-5.41%

-3.22%

8.68%

10.96%

20.52%

Russell Mid Cap TR USD

103

-2.05%

-1.67%

1.07%

13.04%

15.84%

18.07%

Russell 2000 TR USD

127

-2.03%

-2.64%

-1.46%

12.05%

15.27%

18.16%

Russell 3000 Growth TR USD

124

-4.87%

-13.13%

-10.47%

-4.77%

-4.30%

18.16%

Russell 3000 Value TR USD

89

-0.54%

2.18%

3.75%

23.69%

28.77%

21.67%

MSCI ACWI Ex USA 

100

-2.48%

-6.03%

-5.21%

8.69%

12.62%

18.68%

MSCI EAFE 

96

-1.84%

-2.60%

-2.55%

7.98%

12.43%

17.77%

MSCI EM

118

-4.08%

-13.71%

-11.79%

9.14%

10.36%

18.88%

Bloomberg US Agg Bond Index

27

0.40%

2.69%

2.85%

-0.15%

0.27%

4.95%

Bloomberg High Yield Corp Bond Index

34

0.40%

0.29%

0.70%

0.80%

2.20%

7.84%

Bloomberg Commodity Index

40

-4.47%

-5.30%

-4.55%

26.82%

30.71%

13.58%

Wilshire Liquid Alternatives 

26

-0.86%

-1.10%

-0.63%

3.11%

4.73%

6.28%

MSCI US REIT

95

2.04%

5.18%

5.35%

16.34%

16.28%

14.80%

US Dollar

10

-0.48%

-0.61%

0.09%

3.28%

1.34%

-1.12%

Bloomberg US Treasury Bill 1-3mo

1

0.08%

0.37%

0.44%

3.20%

3.82%

4.55%

Source: Morningstar

The TV Benchmark represents an average of the S&P 500, Dow Jones IA, and NASDAQ 100 return indexes. The Orion Risk Score represents risk relative to the global equity market.


Interest Rates as of November 6, 2026

Rate

This Week

1 Wk Δ%

13-Wk Treasury Yield

4.00%

0.03%

10-Yr Treasury Yield

4.86%

-0.06%

Bloomberg US Agg Yield

5.16%

-0.05%

Avg Money Mkt Yield

3.75%

0.00%

Avg 30-Yr Mortgage Rate

7.20%

-0.07%

Sources: Yahoo Finance, S&P Global, Crane Data, BankRate


Key Economic Data Last Week

Data Point

Expectation

Actual

US Manufacturing PMI

-- 

54.9 

ADP Employment

75,000 

86,000 

Nonfarm Payrolls

+59k 

+165k 

US Unemployment Rate

4.2% 

4.1% 

Source: MarketWatch


Key Economic Data This Week

Data Point

Expectation

Release Date

Consumer Price Index (CPI) YoY

-- 

11/10/2026

Core CPI YoY

-- 

11/10/2026

Existing Home Sales

-- 

11/12/2026

Producer Price Index (PPI) YoY

-- 

11/13/2026

Core PPI YoY

-- 

11/13/2026

Source: MarketWatch

 
More Just for You

Want Resources for Your Clients?

Get a version of Weekly Wire you can send directly to your clients. Subscribe to our Weekly Wire newsletter and get a client-friendly version every Monday. Simply download, add your firm's logo, and use with your clients!

The views expressed herein are exclusively those of Orion Portfolio Solutions, LLC d/b/a Brinker Capital Investments, a registered Investment Advisor, and are not meant as investment advice and are subject to change. Information contained herein is derived from sources we believe to be reliable, however, we do not represent that this information is complete or accurate and it should not be relied upon as such. This information is prepared for general information only. It does not have regard to the specific investment objectives, financial situation, and the particular needs of any specific person.

An index is an unmanaged group of assets considered to be representative of a select segment or segments of the market in general, as determined by the index manager for the purposes of managing a specific index. You cannot invest directly in an index.

The CFA® is a globally respected, graduate-level investment credential established in 1962 and awarded by CFA Institute — the largest global association of investment professionals. To learn more about the CFA charter, visit www.cfainstitute.org.

Wealth management services provided by Orion Portfolio Solutions, LLC (“OPS”), a registered investment advisor. Orion OCIO services provided by TownSquare Capital, LLC (“TSC”), a registered investment advisor. OPS and TSC are affiliates and wholly owned subsidiaries of Orion Advisor Solutions, Inc.

The S&P 500 Index is an unmanaged composite of 500-large capitalization companies. This index is widely used by professional investors as a performance benchmark for large-cap stocks.

The Nasdaq 100 Index is a market index that includes 100 of the largest nonfinancial companies listed on the Nasdaq stock exchange, representing diverse sectors like technology and healthcare.

The Bloomberg Barclays US Aggregate Bond Index measures the performance of the total United States investment-grade bond market.

The Nasdaq Composite Index is an index that follows approximately 5000 stocks that trade on the Nasdaq exchange. It is considered a good benchmark for smaller company stocks.

The Dow Jones Industrial Average (DJIA) is a price weighted index of 30 of the largest, most widely held stocks traded on the New York Stock Exchange.

The Russell 3000 Growth Index measures the performance of growth stocks in the broad US equity market.

The Bloomberg Barclays U.S. Corporate High Yield Index measures the market of USD-denominated, non-investment grade, fixed-rate, taxable corporate bonds.

The PHLX Semiconductor Sector Index (SOX) is a modified market capitalization-weighted index composed of companies primarily involved in the design, distribution, manufacture, and sale of semiconductors.