Weekly Notes from Tim

By Tim Holland, CFA, Chief Investment Officer

  • There is more than one way to build an equity index…you could take a geographical approach (country, region, or world); a style approach (growth or value); a size approach (small, medium, or large); a factor approach (momentum, yield, quality) or a sector approach (technology, materials, financials). But once you have identified the stocks you want in your index you must decide how to place them or weight them in your index – market cap, price or equal distribution.
     
  • The most famous index in the world – the S&P 500 – is made up of companies that share certain characteristics – including size and profitability – that are weighted by market cap, meaning the bigger the market cap (which as we know is really just the price of the stock times shares outstanding) the bigger the weight in the index (which is how the Magnificent 7 came to make up about 37% of the S&P 500 at their collective market cap peak). That index, as of February 19th, is up just 0.2% year to date, reflecting a meaningful rotation by investors out of US large cap technology stocks, including the Mag 7 (which still account for about 33% of the index), and into US value and US small cap stocks, which have performed much better of late on an absolute and relative basis.
     
  • We have written why that rotation should prove to be a positive development for the market, as more companies catch a bid and the bull market broadens out, even as US large cap tech stocks stumble (six of the Magnificent 7 stocks are in the red for 2026 with only Nvidia positive, and by less than 1%).  To put a finer point on the performance differential between large cap technology stocks and the rest of the market, the S&P 500 Equal Weighted Index is up 6.1% in 2026, outdistancing the better known, and better followed S&P 500 by 5.9% (see chart).
     
  • Markets have been volatile in 2026, while the market’s bellwether index has done a whole lot of nothing, but if you look past the market cap weighted S&P 500 and focus on the equal weighted S&P 500, the performance story brightens considerably.
Picture 1

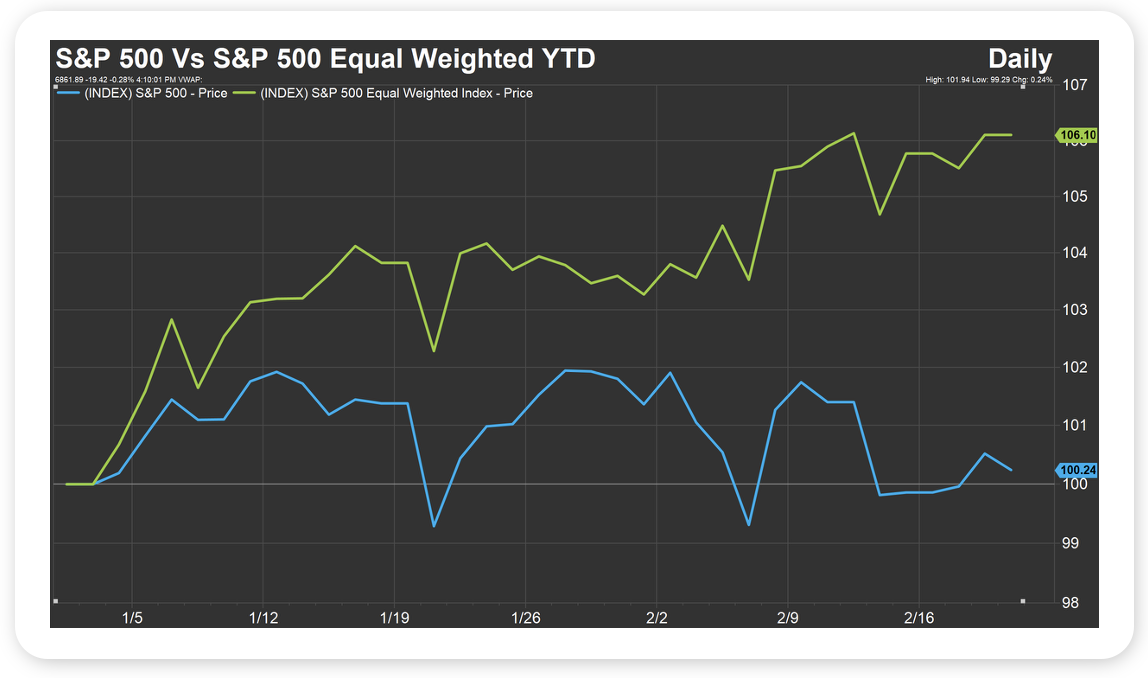
Source: FactSet, February 19, 2026


Looking Back, Looking Ahead

By Ben Vaske, BFA, Manager, Investment Strategy

Last Week

The biggest headline came from the Supreme Court, which struck down the administration’s use of emergency powers under IEEPA to impose sweeping global tariffs. While that ruling removed one policy lever, tariff pressure has not disappeared. The administration has since signaled it is exploring alternative paths to keep trade restrictions in place, keeping policy uncertainty elevated.

Politics aside, markets rebounded broadly on the week. U.S. equities gained more than 1%, led by large caps and growth stocks in a temporary reversal of the early-2026 trend that had favored value and small caps. International equities also posted gains and remain competitive with U.S. markets over longer time frames. Bonds slipped modestly as Treasury yields moved higher.

Q4 GDP surprised to the downside at 1.4%, well below prior estimates that had ranged from roughly 2.5% to as high as 5% in earlier projections. The weakness was largely driven by a sharp decline in government spending. Under the surface, consumer spending grew at a solid 2.4% pace and business investment rose 3.7%, suggesting the private sector remains on firm footing.

This Week

It is NVIDIA week. The company reports after market close on Wednesday, and with a weighting of more than 7% in the S&P 500, its results and guidance carry outsized influence. Given its central role in the AI buildout, the report has the potential to move not only semiconductor stocks but broader market sentiment.

The economic calendar is lighter following last week’s wave of data. Producer Price Index data will be the primary release, offering another read on inflation trends after December’s hotter-than-expected PCE print.

Policy expectations remain steady. Markets are pricing a 97% probability of a hold at the March 18 Fed meeting. Meanwhile, the Atlanta Fed GDPNow model has begun tracking Q1 growth at 3.1%, offering an early look at how momentum may be evolving after the softer Q4 print. 

We hope you have a great week. If there’s anything we can do to help you, please feel free to reach out to ben.vaske@orion.com or opsresearch@orion.com.
 

Get Your Own Market Commentary

Client-Friendly Weekly Wire

Want a version of Weekly Wire you can send directly to your clients? Subscribe to our Weekly Wire newsletter and get a client-friendly version every Monday. Simply download, add your firm's logo, and use with your clients!


Key Data

Stocks, Bonds, Alternatives, and Real Assets as of February 20, 2026

Security Name

Risk Score

1 Wk

1 Mo

QTD

YTD

1 Yr

3 Yr Ann.

Global Equities (60% US, 40% Intl)

100

1.00%

3.29%

4.58%

4.58%

23.03%

19.80%

S&P 500 Total Return

102

1.11%

1.77%

1.11%

1.11%

14.38%

20.89%

Dow Jones Industrial Average

97

0.29%

2.47%

3.44%

3.44%

14.24%

15.77%

NASDAQ 100 Total Return

122

1.15%

0.16%

-0.86%

-0.86%

14.14%

27.47%

TV Benchmark

107

0.85%

1.46%

1.23%

1.23%

14.26%

21.38%

Morningstar US Large Cap

102

1.20%

0.81%

-0.71%

-0.71%

13.97%

22.91%

Morningstar US Mid Cap

113

0.74%

3.97%

6.62%

6.62%

12.83%

13.18%

Morningstar US Small Cap

125

0.75%

2.45%

7.38%

7.38%

16.81%

13.05%

Morningstar US Value

98

0.25%

5.50%

7.44%

7.44%

18.64%

15.55%

Morningstar US Growth

126

1.30%

-0.83%

0.74%

0.74%

10.13%

20.30%

MSCI ACWI Ex USA

98

0.92%

5.80%

9.42%

9.42%

36.09%

18.81%

MSCI EAFE

101

0.86%

5.93%

8.75%

8.75%

32.81%

18.13%

MSCI EM

98

0.79%

5.90%

11.70%

11.70%

42.22%

19.34%

Bloomberg US Agg Bond Index

27

-0.08%

1.51%

1.20%

1.20%

7.48%

4.71%

Bloomberg High Yield Corp Bond Index

41

0.18%

0.54%

0.92%

0.92%

7.79%

9.61%

Bloomberg Commodity Index

70

2.07%

3.46%

9.67%

9.67%

15.72%

9.04%

Wilshire Liquid Alternative Index

25

0.37%

1.57%

1.66%

1.66%

7.45%

6.10%

MSCI US REIT

104

0.28%

6.83%

10.11%

10.11%

9.58%

8.79%

US Dollar

10

1.03%

-1.48%

-0.40%

-0.40%

-8.63%

-1.94%

Bloomberg US Treasury Bill 1-3mo

1

0.06%

0.33%

0.51%

0.51%

4.22%

4.90%

Source: Morningstar

The TV Benchmark represents an average of the S&P 500, Dow Jones IA, and NASDAQ 100 return indexes. The Orion Risk Score represents risk relative to the global equity market.


Interest Rates as of February 20, 2026

Rate

This Week

1 Wk Δ%

13-Wk Treasury Yield

3.60%

0.01%

10-Yr Treasury Yield

4.09%

0.03%

Bloomberg US Agg Yield

4.25%

0.04%

Avg Money Mkt Yield

3.50%

0.01%

Avg 30-Yr Mortgage Rate

6.16%

-0.06%

Sources: Yahoo Finance, S&P Global, Crane Data, BankRate


Key Economic Data Last Week

Data Point

Expectation

Actual

Housing Starts - Nov

1.31M

1.32M

Housing Starts - Dec

1.30M

1.40M

Durable Goods Orders - Dec

-2.0%

-1.4%

U.S. Trade Deficit

-$56.0B

-%70.3B

Fourth Quarter GDP

2.5%

1.4%

Personal Consumption Expenditures (PCE) YoY

2.8%

2.9%

Core PCE YoY

3.0%

3.0%

New Home Sales - Nov

740,000

758,000

New Home Sales - Dec

738,000

745,000

Consumer Sentiment

57.3

56.6

Source: MarketWatch


Key Economic Data This Week

Data Point

Expectation

Release Date

Wholesale Inventories - Dec

0.2%

2/24/26

Consumer Confidence - Feb

87.5

2/24/26

Producer Price Index (PPI) YoY - Jan

--

2/27/26

Core PPI YoY - Jan

--

2/27/26

Source: MarketWatch

 
More Just for You

Want Resources for Your Clients?

Get a version of Weekly Wire you can send directly to your clients. Subscribe to our Weekly Wire newsletter and get a client-friendly version every Monday. Simply download, add your firm's logo, and use with your clients!

The views expressed herein are exclusively those of Orion Portfolio Solutions, LLC d/b/a Brinker Capital Investments, a registered Investment Advisor, and are not meant as investment advice and are subject to change. Information contained herein is derived from sources we believe to be reliable, however, we do not represent that this information is complete or accurate and it should not be relied upon as such. This information is prepared for general information only. It does not have regard to the specific investment objectives, financial situation, and the particular needs of any specific person.

An index is an unmanaged group of assets considered to be representative of a select segment or segments of the market in general, as determined by the index manager for the purposes of managing a specific index. You cannot invest directly in an index.

The CFA® is a globally respected, graduate-level investment credential established in 1962 and awarded by CFA Institute — the largest global association of investment professionals. To learn more about the CFA charter, visit www.cfainstitute.org.

Think2perform’s Behavioral Financial Advice program integrates traditional finance practices with psychology and neuroscience to improve emotional competency and decision-making behavior that increases effective usage of the financial plan with clients. To obtain the Behavioral Financial Advisor (BFA) designation, participants must complete a self-directed course, which takes 20-30 hours to complete, and includes a mix of interactive exercises, videos and case studies. To learn more about the BFA, visit https://www.think2perform.com.

Wealth management services provided by Orion Portfolio Solutions, LLC (“OPS”), a registered investment advisor. Orion OCIO services provided by TownSquare Capital, LLC (“TSC”), a registered investment advisors. OPS and TSC are affiliates and wholly owned subsidiaries of Orion Advisor Solutions, Inc.