


Weekly Notes from Tim
By Tim Holland, CFA, Chief Investment Officer
- As we and others have written, September has been the toughest month for US equities, with the S&P 500, since 1928, averaging a negative 1.2% return and closing to the downside about 55% of the time. Beyond an unfriendly calendar, investors must also contend with increased tariff uncertainty as the US Court of Appeals for the Federal Circuit recently ruled most of President Trump’s tariffs illegal, though the tariffs will remain in place as the Administration appeals the decision to the Supreme Court. While some applaud the court’s decision as an appropriate check on the power of the Executive Branch, it throws US trade policy into further question, including whether the Treasury Department will have to return billions of dollars in tariff revenue.
- And now we face the prospect of a US government shutdown as D.C. confronts a month end deadline to pass funding legislation to keep the government open (which would entail getting several appropriations bills or a continuing resolution through Congress and signed by the President by midnight September 30th).
- The most recent government shutdown was also the longest, lasting from December 22, 2018, through January 25, 2019, as President Trump and Congress argued over funding for a wall on the US – Mexico border. If that period is our frame of reference for stocks if we face another shutdown, it isn’t an encouraging one, as US equities moved lower into year-end 2018, with the S&P 500 off 20% peak to trough (see chart). That said, markets at the time were buffeted by a Federal Reserve aggressively raising rates (4x in 2018) and a US 10 Year / 2 Year Yield Curve that was on the cusp of inverting, a harbinger of recession (whereas today the Fed is likely to cut rates at its September meeting, and the US 10 Year / 2 Year Yield Curve is positively sloped, a harbinger of economic growth). So, we would caution against drawing a straight line from then to now. We are not sure what the next few weeks will bring, but our best guess is our political leaders will compromise just enough to get the government funded, and that the bull market, supported by a growing economy and growing corporate earnings, will power on.
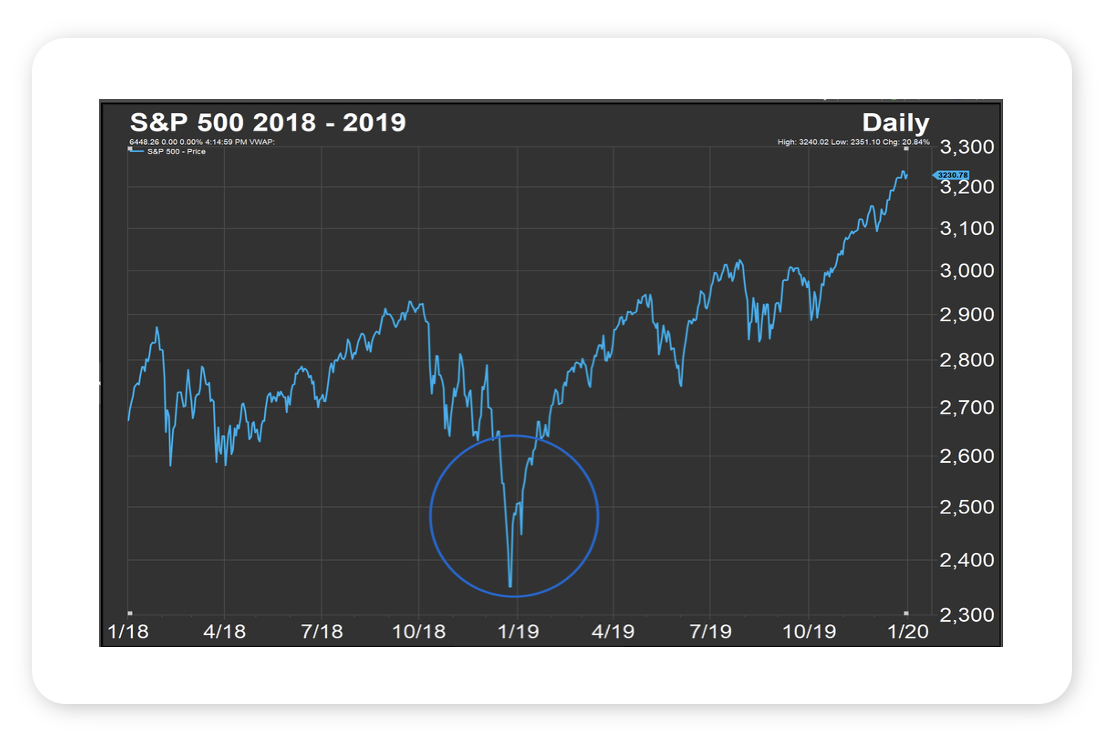
Source: FactSet, September 2025
Looking Back, Looking Ahead
By Ben Vaske, BFA, Manager, Investment Strategy
Last Week
Global equities advanced modestly last week, supported by strength in US tech, small caps, and emerging markets. International equities gained despite a firmer dollar, extending their YTD lead over US markets.
The highlight of the week came Friday with a disappointing Nonfarm Payrolls report. August payrolls increased by just 22,000 compared with expectations of 77,000. Prior months were revised down by 21,000, leaving a net gain of only 1,000 jobs. Additionally, last week marked the first time since 2021 that the number of unemployed individuals exceeded available job openings. Markets reacted quickly, with Treasury yields falling sharply and Fed funds futures pricing a 100% chance of a September rate cut, including a 10% chance of a 50 bps move. Odds of at least three cuts by year-end rose to 70%.
Other data were mixed. The ISM Manufacturing Index rose slightly to 48.7, still in contraction territory for the sixth straight month. In contrast, the ISM Services Index climbed to 52.0, its best level in six months, reinforcing the picture of a resilient US consumer and ongoing services strength. GDP for Q3 is now expected at 3.0% according to the Atlanta Fed, though expectations have drifted lower in recent weeks as forecasts for consumer spending, investment, and exports have softened.
Gold’s long rally continues to attract attention. As of last week, the metal’s cumulative total return since 2005 now exactly matches that of the entire US stock market. Meanwhile, US equities are still trailing the rest of the world in relative terms, on pace for their weakest year since 2009. Even so, the S&P 500 remains up more than 11% YTD.
This Week
Inflation will be the key focus. Both the Producer Price Index and Consumer Price Index are due, and results will be pivotal as the Fed heads into its September 17 meeting. A soft print would reinforce the case for easing, while an upside surprise could complicate the Fed’s decision given last week’s weak labor data, though we are firmly expecting a cut at September’s meeting, regardless.
Overseas, the European Central Bank will release its rate decision. For context, the ECB has cut rates 8 times since June 2024, while the Fed has cut 3 times for a total of 100 bps. Diverging policy paths will remain in focus for currency and global equity markets.
Earnings season is largely wrapped up, though reports from Oracle, Adobe, and GameStop are due this week. According to FactSet, with more than 99% of S&P 500 companies reporting Q2 results, 81% have delivered both EPS and revenue beats. Looking forward, Q3 earnings growth is expected at 7.5%, which would mark the ninth straight quarter of growth.
We hope you have a great week. If there’s anything we can do to help you, please feel free to reach out to ben.vaske@orion.com or opsresearch@orion.com.