


Weekly Notes from Tim
By Tim Holland, CFA, Chief Investment Officer
- Heading into Friday, U.S. equities were on the back foot, with the S&P 500 having logged a fifth consecutive down day for the first time since January and all major domestic equity indices in the red on the week. While there didn’t seem to be an overarching reason for the slight pullback in stocks, some pundits pointed to stretched valuations, some less than stellar earnings from leading retailers and some a more strident tone around U.S. / EU trade relations (the U.S. announced it would keep tariffs on automobiles from the EU at 27.5% for now). Of course, stocks found their footing on Friday and closed sharply higher, with Wall Street cheered by Fed Chairman Powell’s speech at the Kansas City Fed’s Economic Policy Symposium in Jackson Hole teeing up a September rate cut.
- To be more specific, the S&P 500 gained 1.5%, the NASDAQ gained 1.9% and the Dow Jones Industrial Average gained 1.9%. The Dow notched a new all-time high, while the S&P and NASDAQ closed less than 1% and about 1% from their respective all time-highs hit earlier this month (see table). But the focus of this week’s note is on the one index that isn’t like the others, at least as it concerns proximity to its all-time high and that is the Russell 2000, the benchmark for U.S. small cap stocks.
- The Russell 2000 last hit an all-time high on November 25, 2024 (see table) and lags its more widely followed peers on a year-to-date basis by as little as 1.5% and as much as 5%. The two biggest overhangs for small cap stocks since late last year have arguably been worries about U.S. economic growth and interest rates…small cap stocks are more domestic facing than their large cap peers, so a U.S. recession would hit sales and profits hard, and they are more dependent on short-term sources of capital, so rising rates can mean meaningfully higher financing costs. What is encouraging is that as the U.S. economy seems to have made it through a trade policy driven period of uncertainty largely unscathed and the path to the next Fed rate cut has become clearer, small caps have caught a big bid, easily outdistancing their peers on a month to date basis (see table), a point driven home by the Russell’s 3.9% pop on Friday. Three weeks does not a trend make, but ongoing strength in small caps would speak to a broadening out of the bull market and would be another positive for broadly diversified portfolios.
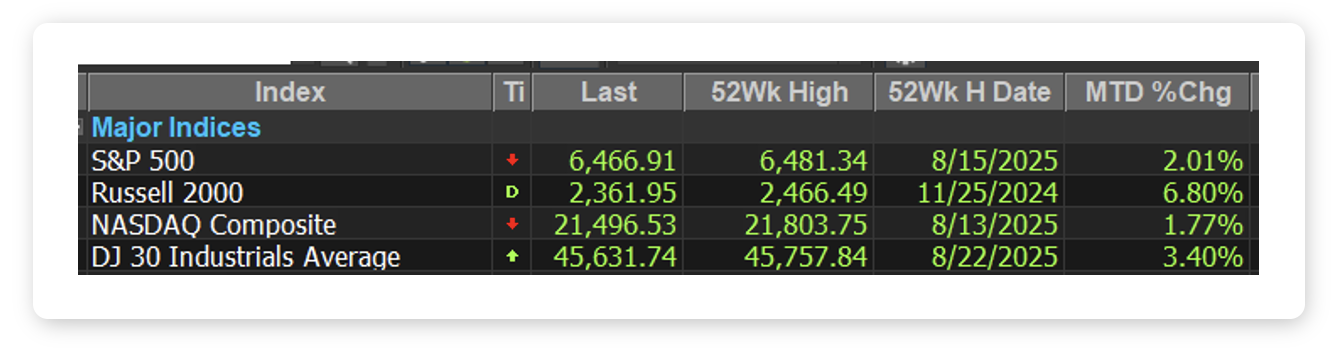
Source: Factset, August 2025
Looking Back, Looking Ahead
By Ben Vaske, BFA, Manager, Investment Strategy
Last Week
Markets rallied on Friday, salvaging gains after an otherwise mixed week. Small caps led the rebound as expectations for a September rate cut surged following Fed Chair Jerome Powell’s Jackson Hole speech. Earlier in the week, equities had been pressured by President Trump’s threat of tariffs as high as 300 percent on imported semiconductors, which weighed heavily on the tech sector.
Powell’s remarks were the highlight of the week. He acknowledged that the labor market has cooled sharply, GDP growth has slowed to 1.2 percent in the first half of 2025, and inflation is running at just over target. While tariffs have lifted goods prices, Powell framed the impact as largely a one-time adjustment rather than a persistent driver of inflation. Importantly, he confirmed that monetary policy remains restrictive but is closer to neutral than a year ago, signaling flexibility for cuts if labor weakness continues. The market took the speech as more dovish than expected, with Fed funds futures pricing an 85 percent chance of a cut at the September 17 meeting.
Economic releases offered some positives. Housing starts rose 5.2 percent in July to their fastest pace in five months, while existing home sales rose 2.0 percent. Still, housing activity remains far below pre-COVID norms. On the rates front, Treasury yields fell Friday as cut expectations strengthened, while the US dollar declined, providing support to international equities. Developed international stocks gained about 1 percent on the week.
This Week
The coming week brings two focal points. First, NVIDIA will report earnings on Wednesday. Given its heavy index weighting, results could influence broad market direction. Second, the Fed’s preferred inflation gauge, the PCE index, will be released Friday. A softer print would reinforce expectations for September easing, while a stronger number could once again temper rate cut odds because while dovish, the Fed is remaining “data dependent.”
Overall, markets remain caught between the crosscurrents of elevated valuations, shifting Fed expectations, and geopolitical risks. Yet, earnings remain supportive, with Q2 growth tracking 11.8 percent, marking a third straight quarter of double-digit gains.
We hope you have a great week. If there’s anything we can do to help you, please feel free to reach out to ben.vaske@orion.com or opsresearch@orion.com.