


Our investment team is closely monitoring the developments in the Middle East and the impact they are having on commodity prices, the stock market, and the world economy. We lament the loss of innocent life, pray for the safety of U.S. troops in harm’s way and mourn the U.S. military servicemembers who have lost their lives.
You will continue to hear from us on the conflict with Iran. In the meantime, if you have any questions on the markets and the economy or if there is anything we can do to support you and your clients during this difficult time, please reach out to us via our Investment Strategy Team’s email address at opsresearch@orion.com.
Weekly Notes from Tim
By Tim Holland, CFA, Chief Investment Officer
- March has not been kind to markets. As we pen this note on the 20th, every major equity index we track has fallen month to date, with the Dow and S&P 500 off 7% and 5.4% and the MSCI EAFE and EM Indices off 9.6% and 8.4%. Bonds have also struggled, with the Bloomberg Aggregate down 1.8%. As to how we got here, the war with Iran has driven oil prices sharply higher and that has Wall Street worried about economic growth (and profits, which has weighed on stocks) and a spike in inflation (which might spell the end of Fed rate cuts and even open the door to rate hikes and has weighed on bonds). As to the underperformance of international equities, that is likely due to those economies’ greater dependence on imported oil and a rallying dollar, an historical headwind for overseas markets.
- During times of great uncertainty, it can be difficult to separate information from noise and land on those datapoints that matter more when it comes to discerning where the economy and markets might be headed. In that vein, if I had to chose one datapoint to monitor over the coming days it would be the yield on the US 10 Year Note, the global reference point for interest rates. As we see in the chart below, when the US economy shutdown during the pandemic and the Fed took rates to zero, the yield on the US 10 Year Note fell to 0.50%; as the US economy reopened and inflationary pressures built, and the Fed took rates to 5.3%, the yield hit 5%. Today, the yield is 4.4%, up from its recent low of 3.96% but off its pandemic era high. I take the recent move in yields to mean investors are worried about inflation, but not excessively so or bonds would have sold off more and the yield would be higher; at the same time, if investors were that worried about growth, the yield should be falling. Said differently, I think the bond market is signaling inflation won’t be a big or permanent problem while the economy won’t fall into recession (the counterargument to this optimistic take on things could be the economy is in trouble, but yields are up because we have entered an era of “stagflation” which means the Fed won’t be able to cut rates to support economic growth; I think it is a timely argument but one not supported by the economic evidence, at least as of today; the longer the war in the Middle East persists the more weight the argument likely takes on).
- As it concerns the one question to keep in mind…What might happen to oil and equity prices – and bond yields – if the US gains control of the Strait of Hormuz?
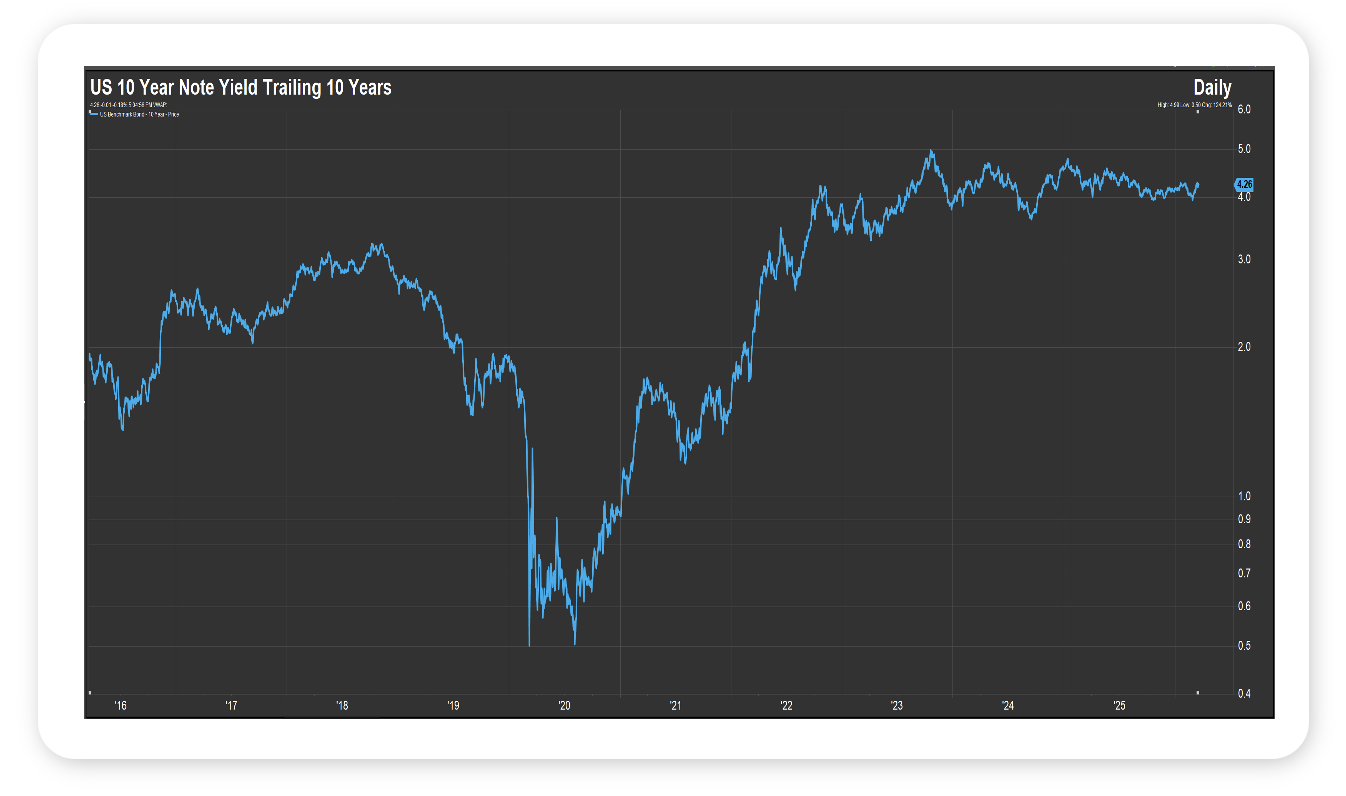
Source: FactSet March 2026
Looking Back, Looking Ahead
By Ben Vaske, BFA, Manager, Investment Strategy
Last Week
Markets remained under pressure last week as geopolitical tensions in Iran continued to drive uncertainty. Global equities declined roughly 2% on the week and are now down about 2%–2.5% year to date, reflecting a sustained risk-off tone across markets.
The Federal Reserve held rates steady at 3.50%–3.75%, as expected. While projections still point to the possibility of a rate cut in 2026, that path has become less certain as rising oil prices and sticky inflation complicate the outlook.
Economic data showed continued strain in interest rate-sensitive areas, with new home sales coming in well below expectations. While winter weather may have played a role, elevated home prices and mortgage rates remain the primary constraint on housing activity.
Performance reflected the broader risk-off environment. U.S. equities declined around 2% with little differentiation across sectors or styles, while international markets held up relatively better. Developed markets remain modestly positive on the year and emerging markets continue to lead with gains of over 4% YTD. The U.S. dollar pulled back slightly on the week but remains higher for the year.
This Week
It’s a lighter week for economic data and earnings, but markets are unlikely to see a slowdown in volatility. Geopolitics remain front and center, with oil prices opening the week near $100 per barrel and continuing to act as a key barometer for risk sentiment, inflation expectations, and global growth concerns.
With fewer scheduled catalysts, markets are likely to remain headline-driven. Investors will be focused on developments in the Middle East, the potential reopening of the Strait of Hormuz, and any signals around policy response. The direction of oil prices will be especially important, as sustained strength could further complicate the inflation outlook and influence expectations for the Fed’s next moves.
We hope you have a great week. If there’s anything we can do to help you, please feel free to reach out to ben.vaske@orion.com or opsresearch@orion.com.