


Weekly Notes from Tim
By Tim Holland, CFA, Chief Investment Officer
- Even with Friday’s sharp sell-off, it has been a remarkable year for markets, with just about every equity index here at home and around the world up and to the right – and some by a whole lot, including emerging market equities up 28%, developed international equities up 23%, semiconductor stocks up 29% and S&P 500 growth stocks up 20%. Not to be left out, traditional US fixed income has returned 6.4% while US corporate bonds have returned over 7%. And then there is gold and silver, up 50%+ and 60%+, respectively, in 2025. Fingers crossed markets can build on these remarkable gains as we move into year-end.
- But this week’s note isn’t about what has gone up this year, but about what has gone down. And to be honest, there wasn’t much of a universe to chose from when we went looking for investable assets that had not rallied in 2025. That written, the price of oil as measured by the US benchmark, West Texas Intermediate (WTI), has fallen 18% year-to-date (see chart, blue line), and we think its worth trying to understand why, and what that price action might mean for the US economy.
- Trying to determine what is moving the price of a globally traded, systemically important commodity like oil can be tricky…has there been a supply shock; are markets over-supplied; is geo-political risk a factor, or is global GDP falling and with it demand? Today, it seems a few factors have been weighing on the price of oil…OPEC+ (the Organization of Petroleum Exporting Countries plus other oil producing nations like Russia) has announced a series of production increases in 2025; global economic growth slowed earlier this year, and US oil production is expected to hit a record 13.5 million barrels per day in 2025.
- There was a time when a drop in the price of oil was seen as an unmitigated positive for the US economy. Now that the US is the world’s leading oil producer, the situation is more nuanced. All things being equal, we see the 18% drop in the price of oil as a welcome development, especially if it leads to lower prices at the pump, providing relief for the US consumer, particularly the US consumer at the lower end of the income spectrum (while prices are lower at the pump year on year, they are about flat year to date). One thing we are not worried about is an unexpected and dramatic spike in the price of oil along the lines of what we saw in 2008 or in 2022, with the former being an unappreciated catalyst for the Great Recession and the latter feeding the great pandemic era spike in inflation.
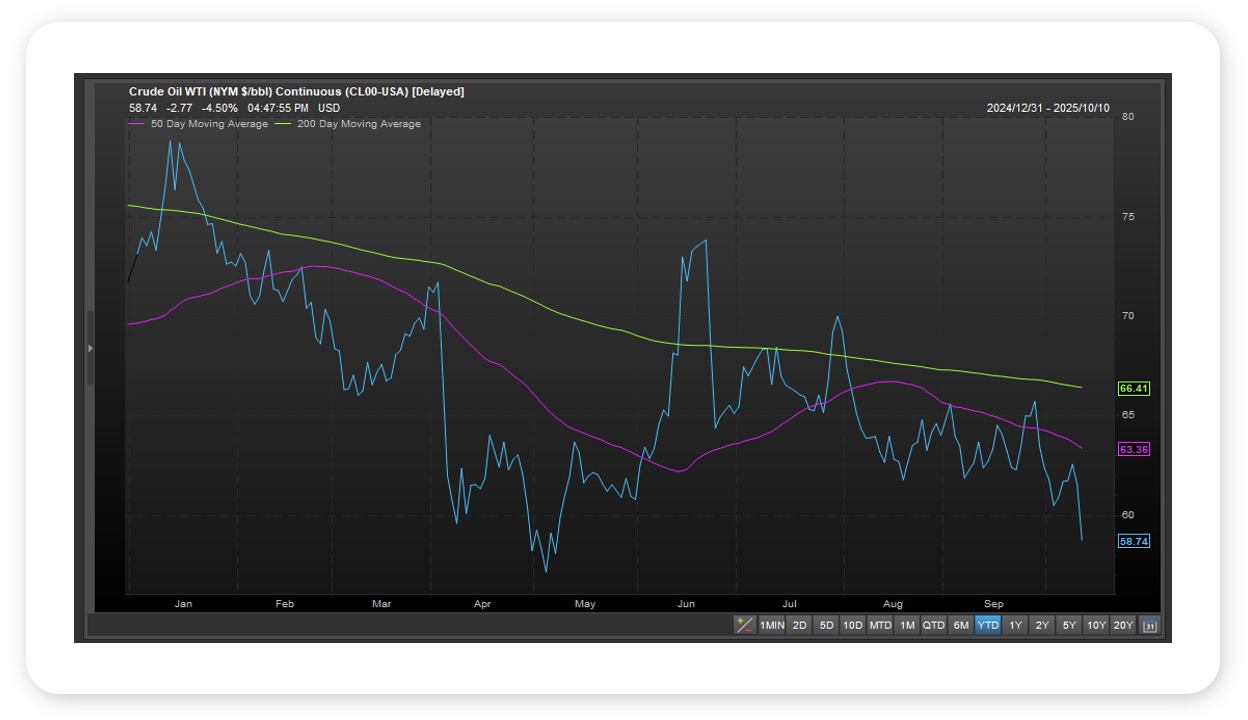
Source: FactSet, October 2025
Looking Back, Looking Ahead
By Ben Vaske, BFA, Manager, Investment Strategy
Last Week
Markets struggled to close out the week as trade tensions between the U.S. and China reignited. After trading flat through Thursday, equities sold off sharply on Friday, pushing the S&P 500 down roughly 2.5% for the week, marking the first 2%+ decline since April. Small caps fared worse, losing nearly 4%, while international equities dropped 1.5% on a stronger dollar and global trade uncertainty. Even with the pullback, the S&P 500 remains up about 12.5% year-to-date, and foreign stocks continue to lead global markets with gains of roughly 27% this year.
Back to the US and China, trade tensions came back to the surface as China “delivered” a letter to key trading partners outlining an export restriction on rare earth minerals. China is a key region in the excavation of these minerals globally, and export restrictions will be a headwind to manufacturing and research and development, notably within the AI space. In retaliation to the announcement, US President Donald Trump announced a renewed 100% tariff on imports from China, set to start on November 1st. Trade uncertainty had generally dissipated relative to earlier in 2025, so this renewed shock sent renewed trade fears throughout global markets.
The U.S. government shutdown continued into its second week, reaching 13 days as of this writing. Betting markets now expect the closure to last about 31 days, which would make it the second longest in U.S. history.
Investor sentiment, which had been pessimistic for much of the year, showed signs of turning last week. The latest AAII Sentiment Survey reported 46% of participants as bullish, the highest level since December 2024. However, Friday’s selloff may temper some of that renewed optimism in the near term.
This Week
Markets will likely remain focused on U.S.-China trade headlines as negotiations are likely to begin. Economic data releases are expected to remain sparse, as the government shutdown delays most reports. It has, however, been announced that next week’s Consumer Price Index will be published regardless of the shutdown’s status, which could provide an important update on inflation trends going into the late month Federal Reserve interest rate decision.
According to the CME FedWatch Tool, there is now a 98% chance of another 25 bp cut at the Federal Reserve’s October 29 meeting and a 92% probability of two additional cuts by year-end (including the expected October cut). The Atlanta Fed’s GDPNow model continues to project Q3 growth at 3.8%.
We hope you have a great week. If there’s anything we can do to help you, please feel free to reach out to ben.vaske@orion.com or opsresearch@orion.com.