





















Our investment team is closely monitoring the developments in the Middle East and the impact they are having on commodity prices, the stock market, and the world economy. We lament the loss of innocent life, pray for the safety of U.S. troops in harm’s way and mourn the U.S. military servicemembers who have lost their lives.
You will continue to hear from us on the conflict with Iran. In the meantime, if you have any questions on the markets and the economy or if there is anything we can do to support you and your clients during this difficult time, please reach out to us via our Investment Strategy Team’s email address at opsresearch@orion.com.
Weekly Notes from Tim
By Tim Holland, CFA, Chief Investment Officer
- ….isn’t just a classic John Hughes film starring Steve Martin and the late, great John Candy (Uncle Buck is an all-time favorite of mine), it is the focus of this week’s note; more specifically, the Dow Jones Transportation Average and what the Index might be telling us about the health of the US economy and US stock market.
- As you know, the Dow Transports – as the Index is often called – consists of 20 companies, including Delta and United Airlines; Kansas City Southern and Union Pacific Railroads and Avis Budget Group, as well as leading trucking and logistics companies, including J.B. Hunt and delivery services companies, including UPS. Not surprisingly, the Index is a bellwether for the US economy – if folks aren’t getting on planes and packages aren’t being delivered the economy is probably in poor shape – as well as a key input for what I think was the first system of technical market analysis ever developed – Dow Theory. At a high level, Dow Theory, which was developed in the late 19th century by Charles H. Dow, founder of The Wall Street Journal and creator of the Indices that bear his name, posits that the performance of the Dow Jones Industrial Average and the Dow Jones Transportation Average must confirm each other for a market trend to be established. Said differently, if the Industrials are breaking out to new highs while the Transports are rolling over, there is no established trend, and the strong performance of the Industrial Average should be viewed suspiciously.
- Fortunately, for those who put stock in Dow Theory, the Industrials and Transports have started 2026 on the front foot, with the former up 9% year-to-date and having notched an all-time high on July 1st, and the latter off to its best start to a year since 1991, up 27% (see chart). No one knows what the second half of 2026 might bring, but for now, if the Dow Transports and Dow Theory are to be believed, the US economy and US stock market are going from strength to strength.
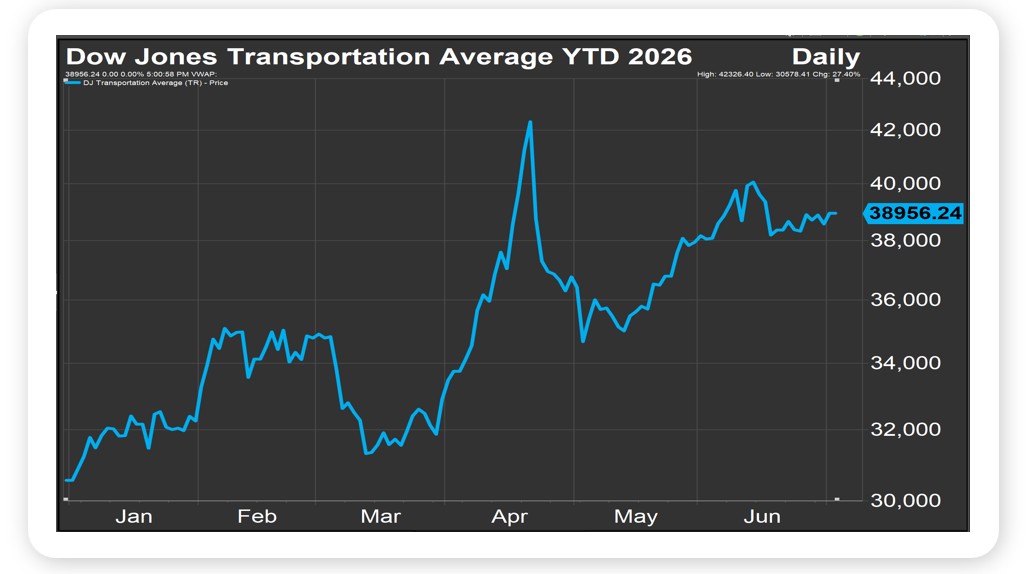
Source, FactSet July 2026
Looking Back, Looking Ahead
By Ben Vaske, CFA, Manager, Investment Strategy
Last Week
It was a tale of two markets last week. U.S. tech stumbled, with major semiconductor names falling roughly 10% on Wednesday alone, but the broader S&P 500 finished the week up nearly 2% as investors rotated into other areas of the market. International stocks also had a strong week, aided by a U.S. dollar that fell more than half a percent. At the halfway point of 2026, all major indexes remain in positive territory, and globally diversified, balanced portfolios have rewarded investors who stayed the course through a volatile start to the year.
The June employment report came in well below expectations, with 54,000 nonfarm payrolls added against a consensus of 113,000, and prior months were revised lower by a combined 74,000. The unemployment rate ticked down to 4.2%, though the decline was driven by a shrinking labor force rather than genuine job creation. Adding to the growth concern, the Atlanta Fed's Q2 GDPNow estimate fell from 3% to just 1.2% over the course of June, primarily reflecting weaker consumer spending, private inventories, and net exports. The Fed's next meeting is July 29th, with markets now pricing a 78% probability of a hold and a 22% chance of a hike.
This Week
The Fed minutes from the June meeting will be released Wednesday and are expected to draw more attention than usual, as Kevin Warsh did not clearly signal his policy views in the first dot plot of his chairmanship. The minutes may offer meaningful color on how the new Fed chair intends to approach his role and communicate with markets. SpaceX officially joins the NASDAQ 100 on Tuesday, marking the first expedited index inclusion among the anticipated mega IPOs. The economic calendar is light, with U.S. Services PMI, consumer credit, and existing home sales as the primary releases. On the earnings front, PepsiCo and Delta Airlines headline a quiet week before Q2 season accelerates with major financial institutions reporting next week.
We hope you have a great week. If there’s anything we can do to help you, please feel free to reach out to ben.vaske@orion.com or opsresearch@orion.com.