Weekly Notes from Tim

By Tim Holland, CFA, Chief Investment Officer

  • Democrats are celebrating electoral successes in New York City, Virginia, and New Jersey, Republicans are trying to determine what lessons should be learned, if any, from last week’s losses and the US Government remains closed, a shutdown that has run a record 38 days (as of the writing of this note). When politicians succeed at politics, they earn the right to set policy. And given Wall Street’s recent interest in politics, we thought now a good time to revisit Federal fiscal policy – how we are taxing and spending at the national level – and what it might mean for the US economy in 2026.
     
  • From a legislative point of view, one could argue the signature success of this Congress and White House was the passage of the One Big Beautiful Bill Act, which extended tax cuts from 2017’s Tax Cuts & Jobs Act, enacted tax cuts tied to income from Social Security, overtime and tips and incented companies to invest in productive assets. Agree or disagree with the Republican party’s policy path, most pundits see the OBBBA as stimulating the economy through 2026. 
     
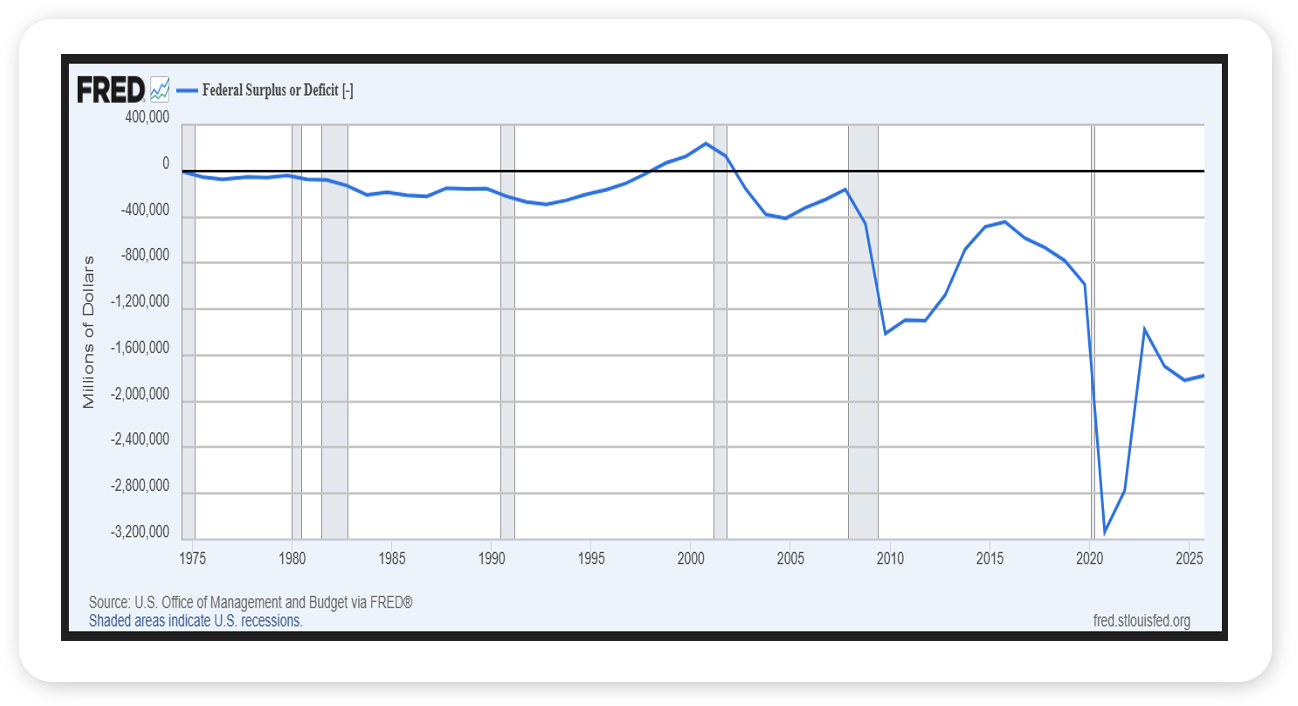
  • On the other side of the tax and spending ledger, we continue to spend well beyond our means, running a Federal deficit of approximately $1.8 trillion in the fiscal year ended September 30th, or about 6% of US GDP (see chart). And while the government remains shutdown, and Republicans and Democrats have not been able to work through legislation to fund the government through September 2026, most DC watchers expect the US to run a comparable deficit – on an absolute basis and as a percentage of GDP – again this fiscal year. And that matters for the economy as deficit spending, especially on the scale that the US has and is expected to engage in, should be very supportive of growth, as the government puts more money into the hands of consumers and spends heavily on goods and services.
     
  • Fiscal policy, broadly speaking, should prove to be a pretty big tailwind for the US economy in 2026.
     
Picture 1

Source: Federal Reserve Bank of St, Louis, November 2025


Looking Back, Looking Ahead

By Ben Vaske, BFA, Manager, Investment Strategy

Last Week

Markets struggled as the prolonged government shutdown began to ripple through the economy. Technology and semiconductor stocks led losses, weighed down by stretched valuations and rising short interest. Despite the pullback, year-to-date returns for balanced portfolios remain strong.

The University of Michigan’s consumer sentiment survey dropped to near record lows, with respondents citing the ongoing shutdown as a primary concern. The delayed Nonfarm Payrolls report has left the ADP Private Employment report as the best current gauge of labor trends, which showed moderate job gains in the trades, education, and health sectors, while professional and information jobs contracted. The labor market remains a top-of-mind concern for the Federal Reserve.

Corporate developments continued to highlight the dual nature of the current cycle: resilience in earnings alongside emerging risks. AI-driven capex remains elevated, as mega-cap firms continue to invest heavily in infrastructure and hardware. However, layoffs have recently accelerated, particularly at UPS, Amazon, and Intel, raising concerns of “AI washing,” a new term coined to describe companies attributing workforce reductions to AI rather than slower business performance. 


This Week

Last night, the US Senate reached the required 60 votes to reopen the government. Once the measure if officially passed, it will move to the House for a vote and the government is likely to be reopened within the next few days. In the meantime, the U.S. Department of Transportation announced roughly 10% of flights will be canceled this week as air-traffic operations face growing staffing challenges, creating a potential drag on travel and business activity.

It’s another full week for earnings, though without any of the mega-cap tech names. With nearly all S&P 500 companies having reported, third-quarter earnings growth stands at 13.1% year-over-year, the fourth straight quarter of double-digit growth. However, the strength in earnings is being met with recently slowing manufacturing data.

Inflation data is expected later this week, though the release is set to be delayed if the government shutdown continues. The Federal Reserve’s next policy meeting is scheduled for December 10. Market expectations, according to CME FedWatch, currently imply a 67% chance of another 25-basis-point rate cut. The Atlanta Fed’s GDPNow model estimates Q3 GDP growth at 4.0%, slightly higher than last week. 
 

We hope you have a great week. If there’s anything we can do to help you, please feel free to reach out to ben.vaske@orion.com or opsresearch@orion.com.
 

Get Your Own Market Commentary

Client-Friendly Weekly Wire

Want a version of Weekly Wire you can send directly to your clients? Subscribe to our Weekly Wire newsletter and get a client-friendly version every Monday. Simply download, add your firm's logo, and use with your clients!


Key Data

Stocks, Bonds, Alternatives, and Real Assets as of November 7, 2025

Security Name

Risk Score

1 Wk

1 Mo

QTD

YTD

1 Yr

3 Yr Ann.

Global Equities (60% US, 40% Intl)

100

-1.34%

-0.05%

0.74%

20.29%

17.22%

21.02%

S&P 500 Total Return

102

-1.61%

0.28%

0.69%

15.63%

14.13%

22.69%

Dow Jones Industrial Average

97

-1.21%

0.88%

1.35%

11.97%

9.30%

14.90%

NASDAQ 100 Total Return

122

-3.08%

0.90%

1.57%

19.96%

19.62%

32.73%

TV Benchmark

107

-1.97%

0.69%

1.21%

15.85%

14.35%

23.44%

Morningstar US Large Cap

102

-1.97%

0.59%

1.06%

17.50%

16.66%

25.36%

Morningstar US Mid Cap

113

-0.41%

-1.10%

-1.01%

9.02%

5.39%

14.07%

Morningstar US Small Cap

125

-0.28%

-0.51%

-0.03%

8.77%

3.42%

13.04%

Morningstar US Value

98

0.26%

-0.12%

0.31%

12.91%

8.22%

13.38%

Morningstar US Growth

126

-2.88%

-1.71%

-1.50%

14.13%

12.46%

25.19%

MSCI ACWI Ex USA

98

-1.02%

-0.48%

0.99%

29.90%

22.54%

19.19%

MSCI EAFE

101

-0.76%

-0.80%

0.42%

26.25%

21.56%

19.35%

MSCI EM

98

-1.39%

0.55%

2.74%

31.74%

24.53%

18.89%

Bloomberg US Agg Bond Index

27

0.03%

0.42%

0.65%

6.82%

6.04%

5.84%

Bloomberg High Yield Corp Bond Index

41

-0.29%

-0.24%

-0.14%

7.07%

7.27%

10.33%

Bloomberg Commodity Index

70

0.08%

1.17%

2.97%

12.63%

12.74%

1.65%

Wilshire Liquid Alternative Index

25

-0.16%

0.37%

0.41%

6.11%

3.99%

5.80%

MSCI US REIT

104

1.52%

1.00%

-0.06%

4.65%

0.32%

9.68%

US Dollar

10

0.21%

1.66%

2.00%

-8.07%

-5.10%

-3.47%

Bloomberg US Treasury Bill 1-3mo

1

0.08%

0.37%

0.44%

3.70%

4.43%

4.92%

Source: Morningstar

The TV Benchmark represents an average of the S&P 500, Dow Jones IA, and NASDAQ 100 return indexes. The Orion Risk Score represents risk relative to the global equity market.


Interest Rates as of November 7, 2025

Rate

This Week

1 Wk Δ%

13-Wk Treasury Yield

3.76%

0.04%

10-Yr Treasury Yield

4.09%

-0.01%

Bloomberg US Agg Yield

4.35%

-0.01%

Avg Money Mkt Yield

3.83%

-0.09%

Avg 30-Yr Mortgage Rate

6.19%

-0.04%

Sources: Yahoo Finance, S&P Global, Crane Data, BankRate


Key Economic Data Last Week

Data Point

Expectation

Actual

ISM Manufacturing

49.3

48.7

*U.S. Trade Deficit

-$65.1B

DELAYED

*Job Openings

7.2M

DELAYED

ADP Employment

22,000

42,000

ISM Services

50.5

52.4

*U.S. Employment Report

-60,000

DELAYED

*U.S. Unemployment Rate

4.5%

DELAYED

Source: MarketWatch


Key Economic Data This Week

Data Point

Expectation

Release Date

*Consumer Price Index (CPI) YoY

--

11/13/25

*Core CPI YoY

--

11/13/25

*U.S. Retail Sales

--

11/14/25

*Producer Price Index (PPI) YoY

--

11/14/25

Core PPI YoY

--

11/14/25

*Business Inventories

--

11/14/25

Source: MarketWatch

 
More Just for You

Want Resources for Your Clients?

Get a version of Weekly Wire you can send directly to your clients. Subscribe to our Weekly Wire newsletter and get a client-friendly version every Monday. Simply download, add your firm's logo, and use with your clients!

The views expressed herein are exclusively those of Orion Portfolio Solutions, LLC d/b/a Brinker Capital Investments, a registered Investment Advisor, and are not meant as investment advice and are subject to change. Information contained herein is derived from sources we believe to be reliable, however, we do not represent that this information is complete or accurate and it should not be relied upon as such. This information is prepared for general information only. It does not have regard to the specific investment objectives, financial situation, and the particular needs of any specific person.

An index is an unmanaged group of assets considered to be representative of a select segment or segments of the market in general, as determined by the index manager for the purposes of managing a specific index. You cannot invest directly in an index.

The CFA® is a globally respected, graduate-level investment credential established in 1962 and awarded by CFA Institute — the largest global association of investment professionals. To learn more about the CFA charter, visit www.cfainstitute.org.

Think2perform’s Behavioral Financial Advice program integrates traditional finance practices with psychology and neuroscience to improve emotional competency and decision-making behavior that increases effective usage of the financial plan with clients. To obtain the Behavioral Financial Advisor (BFA) designation, participants must complete a self-directed course, which takes 20-30 hours to complete, and includes a mix of interactive exercises, videos and case studies. To learn more about the BFA, visit https://www.think2perform.com.

Wealth management services provided by Orion Portfolio Solutions, LLC (“OPS”), a registered investment advisor. Orion OCIO services provided by TownSquare Capital, LLC (“TSC”), a registered investment advisors. OPS and TSC are affiliates and wholly owned subsidiaries of Orion Advisor Solutions, Inc.