





















Our investment team is closely monitoring the developments in the Middle East and the impact they are having on commodity prices, the stock market, and the world economy. We lament the loss of innocent life, pray for the safety of U.S. troops in harm’s way and mourn the U.S. military servicemembers who have lost their lives.
You will continue to hear from us on the conflict with Iran. In the meantime, if you have any questions on the markets and the economy or if there is anything we can do to support you and your clients during this difficult time, please reach out to us via our Investment Strategy Team’s email address at opsresearch@orion.com.
Weekly Notes from Tim
By Tim Holland, CFA, Chief Investment Officer
- Wall Street had several things to wonder about and worry over last week, including Treasury’s increased bond buyback program, rising yields, the end of the US / Iran ceasefire (and a concurrent jump in oil prices), and US government debt passing the $40 trillion mark. That final development is the focus of this week’s note.
- I do not defend our great nation’s financial profligacy and do not dismiss its potential impact on the economy and the markets; as a child of children of the Great Depression, I am no fan of debt and believe America must get its financial house in order. That written, I do think some perspective on our current fiscal position is important, particularly that we have – as a nation – been here before, and that much of what we have borrowed we have borrowed from ourselves.
- Of the $40 trillion in US debt, $8 trillion is intragovernmental debt, representing transactions between one part of the US Federal Government and another, and $32 trillion is debt held by the public. Most economists see debt held by the public as the most meaningful measure of debt as it reflects what has been borrowed from outside lenders through financial markets to support government activities. At $32 trillion, debt held by the public approximates US GDP, below the all-time high ratio of public debt to GDP of 106% reached in 1946. Breaking down the $32 trillion held by the public, a bit north of 70% is held by domestic entities – think mutual funds and insurance companies – and near 30% is held by foreign governments and investors, with the greatest representation being in Japan and the U.K. (China ranks third). Finally, total US debt to GDP of 123% is down from the record high of 133% reached in 2020 (see chart).
- If one wanted to put an optimistic spin on our country’s fiscal position, one could cite the following…key debt to GDP ratios are high, but below historic highs; the US is heavily indebted, but not as indebted as some other countries (e.g., Japan); nearly all our debt is held by domestic sources or by countries we count as allies; yields on US bills, notes and bonds have moved higher but remain within their respective 20-year ranges, and if the US economy can continue to expand and if the US government can get spending under control, we can, over time, grow our way out of our current indebted position. We have done it before.
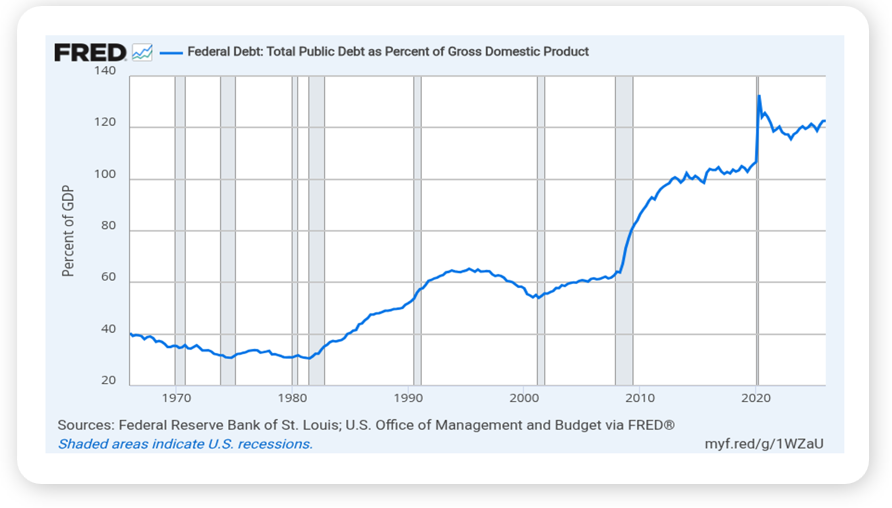
Source: Federal Reserve Bank of St. Louis, August 2026
Looking Back, Looking Ahead
By Ben Vaske, CFA, Manager, Investment Strategy
Last Week
The S&P 500 snapped a three-week winning streak as a confluence of headwinds weighed on sentiment. Higher borrowing costs, geopolitical pressure, and an oil price bounce of roughly 7% pushed risk assets lower, with U.S. large cap growth stocks leading the decline while value equities gained ground. The quarter-to-date rotation story remains firmly in place, with value up approximately 8% and the NASDAQ in negative territory for the period. International markets were mixed, with developed markets retreating while emerging markets gained over 1%. The U.S. dollar fell more than 1% on the week, lifting gold, Bitcoin, and commodity prices broadly, with Bitcoin posting a particularly sharp 19% gain and gold adding 6%.
The week's most consequential development came Wednesday when the U.S. Treasury announced plans to at least double its buyback operations on long-dated Treasury bonds in an effort to suppress long-end yields. The initial reaction pushed yields briefly lower before they quickly reversed to even higher levels, leaving the primary market impact in the dollar debasement trade rather than the bond market itself. On the economic front, Flash Services PMI hit its highest reading since late 2024 at 56.8, handily beating expectations and reinforcing that the services sector remains a durable pillar of the expansion. Separately, the NFIB Small Business Hiring Plans Index posted its largest month-over-month increase on record in July, with 20% of small business owners signaling intent to hire over the next three months against a long-term average of 11%.
This Week
Three events will dominate the week. PCE inflation is due Wednesday, with consensus expectations for a 3.6% headline and 3.3% core reading, providing the Fed's historically preferred inflation gauge ahead of the September meeting. Wednesday evening, NVIDIA reports after the close, having recently announced price increases of more than 15% on its AI servers and chips, making forward guidance on demand and capital spending the central focus. On Friday, Kevin Warsh delivers his first Jackson Hole address as Fed Chair, and with forward guidance removed from recent policy communications, investors will be scrutinizing his remarks closely for any signal on the direction of rates at the September 16th FOMC meeting, currently priced at 40% probability of a hike and 60% hold.