Weekly Notes from Tim

By Tim Holland, CFA, Chief Investment Officer

  • Despite the big bounce Friday, markets moved lower last week, continuing what has been – uncharacteristically – a rough November for stocks, with the S&P 500, the Nasdaq and the Russell 2000 off 3.5%, 6% and 4.4% month to date, respectively.  
     
  • As to why stocks have struggled during what has historically been the start of the seasonally strong stretch for the markets, we would call out three catalysts….1) valuation – the S&P 500 came into November trading about 23 times expected earnings, above its average 10-year P/E multiple of 19 times 2) AI – while Wall Street seems all in on AI’s power to transform the economy, it has grown concerned over the size and opacity of some investments made by the leading AI chip, software and data center players both independent of each other and in each other, spurring talk of an AI bubble akin to the dot-com bubble of the late 1990s and 3) The Fed – following the Fed’s October meeting Wall Street’s confidence in a December meeting rate cut waned (though comments Friday by NY Fed President Williams had Wall Street thinking a rate cut at the upcoming meeting was back on the table).  
     
  • While not being dismissive of the sharp pullback in stocks and the concern it has caused for investors, we think, as always, that perspective is important. The S&P, Nasdaq and Russell 2000 sit just 4.6%, 7.3% and 6.8% from their respective all-time highs and are up year to date, having gained 12.3%, 15.3% and 6.3% since January. And while investors have rightly focused on equity market volatility, it is worth pointing out fixed income, as measured by the Bloomberg US Aggregate Index is flat month to date and up about 7% this year, which means a classic 60% S&P 500 / 40% Bloomberg Aggregate portfolio has delivered a 10% return in 2025. Finally, if we zoom out the recent pullback in the S&P barely registers to the eye, at least to my eye, though my eyesight isn’t what it once was (please see chart).  
     
  • We are not ready to throw in the towel on the bull market….mid-teens earnings growth from the S&P 500 goes a long way to offset valuation risk; recent quarterly results from Nvidia – the company beat expectations and raised guidance – indicate AI fundamentals are robust and the Fed, we think, remains in a rate cutting cycle. Market pullbacks are never fun, but they are a price we must pay if we are to benefit from the incredible wealth creation US stocks offer over the long-term.  
     
  • It has been a remarkable year so far, and as always, I have much to be thankful for. And we wish you and your loved ones a very happy and healthy Thanksgiving.  

     
Picture 1

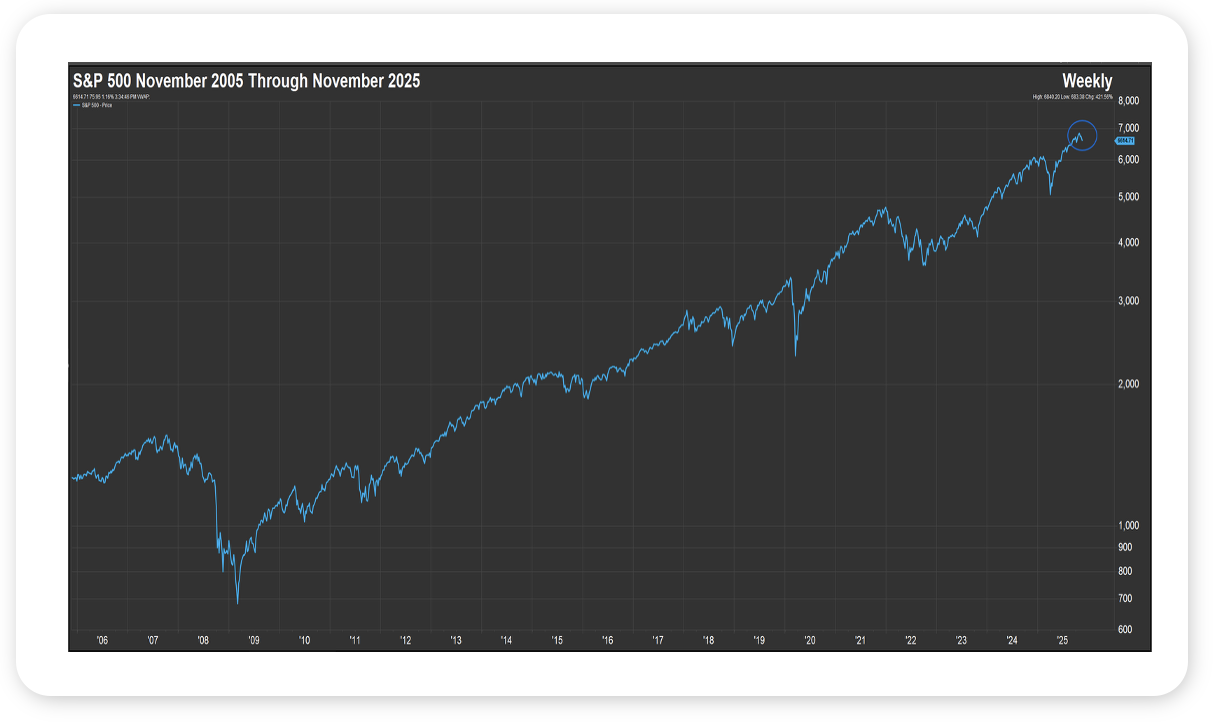
Source: FactSet, November 2025


Looking Back, Looking Ahead

By Ben Vaske, BFA, Manager, Investment Strategy

Last Week

Markets were broadly negative last week as volatility increased, marking a second consecutive decline as investors continued to question whether extended valuations in technology and artificial intelligence related firms can be sustained. The NASDAQ 100 lost just over 3%, while the S&P 500 also moved lower. International equities were under pressure as well, falling more than 3% on the week amid renewed dollar strength.

The long-delayed September employment report showed stronger-than-expected job gains but also a rise in the unemployment rate. Nonfarm payrolls increased by 119,000, roughly twice the consensus estimate, while the unemployment rate ticked up to 4.4%. The data reaffirmed that the labor market remains resilient but is gradually cooling.

The housing market showed tentative signs of stabilization. Existing home sales rose 1.2% in October to a 4.1 million annualized pace, the largest increase in eight months, as lower mortgage rates enticed some buyers back into the market.

Nvidia headlined last week’s earnings reports, beating both revenue and earnings expectations. With results from all “Mag 7” firms now in, Q3 was firmly a positive quarter for the mega cap firms leading markets.  


This Week

Markets will pause for the Thanksgiving holiday, with U.S. exchanges closed Thursday and closing at 1p ET on Friday. Historically, shortened trading weeks tend to bring less volatility.

Economic data will return to a more normal cadence now that the government is fully reopened. Key releases this week include U.S. Retail Sales and the Producer Price Index (PPI) on Tuesday and September’s Durable Goods Orders on Wednesday.

On the monetary policy front, the probability of a December rate cut has rebounded to about 70% after dovish comments and a slowing labor market.

According to the Atlanta Fed GDPNow model, Q3 GDP is estimated at 4.2%. While growth remains solid, uncertainty around inflation, jobs, and policy continues to drive short-term volatility.  
 

We hope you have a great week. If there’s anything we can do to help you, please feel free to reach out to ben.vaske@orion.com or opsresearch@orion.com.
 

Get Your Own Market Commentary

Client-Friendly Weekly Wire

Want a version of Weekly Wire you can send directly to your clients? Subscribe to our Weekly Wire newsletter and get a client-friendly version every Monday. Simply download, add your firm's logo, and use with your clients!


Key Data

Stocks, Bonds, Alternatives, and Real Assets as of November 21, 2025

Security Name

Risk Score

1 Wk

1 Mo

QTD

YTD

1 Yr

3 Yr Ann.

Global Equities (60% US, 40% Intl)

100

-2.40%

-2.27%

-1.20%

17.97%

16.62%

18.61%

S&P 500 Total Return

102

-1.91%

-1.85%

-1.11%

13.56%

12.44%

20.42%

Dow Jones Industrial Average

97

-1.85%

-1.30%

-0.11%

10.35%

7.22%

13.27%

NASDAQ 100 Total Return

122

-3.04%

-3.46%

-1.69%

16.10%

17.72%

29.04%

TV Benchmark

107

-2.27%

-2.20%

-0.97%

13.34%

12.46%

20.91%

Morningstar US Large Cap

102

-2.06%

-1.71%

-0.81%

15.33%

15.21%

23.02%

Morningstar US Mid Cap

113

-1.57%

-3.52%

-3.33%

6.46%

1.08%

11.77%

Morningstar US Small Cap

125

-0.54%

-2.75%

-1.76%

6.89%

1.27%

11.42%

Morningstar US Value

98

-0.98%

-0.31%

0.19%

12.78%

7.35%

12.32%

Morningstar US Growth

126

-3.07%

-5.86%

-5.27%

9.76%

7.09%

21.85%

MSCI ACWI Ex USA

98

-3.31%

-2.72%

-1.12%

25.23%

24.20%

16.46%

MSCI EAFE

101

-3.39%

-2.78%

-1.38%

23.99%

23.62%

16.41%

MSCI EM

98

-3.71%

-3.50%

-0.76%

27.24%

26.34%

16.07%

Bloomberg US Agg Bond Index

27

0.45%

-0.46%

0.86%

7.05%

6.81%

4.85%

Bloomberg High Yield Corp Bond Index

41

0.03%

-0.14%

-0.06%

7.15%

7.15%

9.70%

Bloomberg Commodity Index

70

-1.37%

1.95%

3.33%

13.02%

13.40%

2.53%

Wilshire Liquid Alternative Index

25

-0.44%

-0.35%

0.15%

5.84%

3.89%

5.41%

MSCI US REIT

104

0.20%

-1.83%

-1.16%

3.50%

-1.97%

7.60%

US Dollar

10

1.01%

1.59%

2.44%

-7.68%

-6.11%

-2.16%

Bloomberg US Treasury Bill 1-3mo

1

0.07%

0.36%

0.59%

3.85%

4.39%

4.92%

Source: Morningstar

The TV Benchmark represents an average of the S&P 500, Dow Jones IA, and NASDAQ 100 return indexes. The Orion Risk Score represents risk relative to the global equity market.


Interest Rates as of November 21, 2025

Rate

This Week

1 Wk Δ%

13-Wk Treasury Yield

3.74%

-0.05%

10-Yr Treasury Yield

4.06%

-0.09%

Bloomberg US Agg Yield

4.32%

-0.08%

Avg Money Mkt Yield

3.76%

-0.01%

Avg 30-Yr Mortgage Rate

6.28%

0.02%

Sources: Yahoo Finance, S&P Global, Crane Data, BankRate


Key Economic Data Last Week

Data Point

Expectation

Actual

Housing Starts

--

DELAYED

U.S. Trade Deficit

-$61.0B

-$59.6B

U.S. Employment Report

50,000

119,000

Unemployment Rate

4.3%

4.4%

Existing Home Sales

4.1M

4.1M

U.S. Leading Economic Indicators

--

DELAYED

Consumer Sentiment

51.0

51.0

Source: MarketWatch


Key Economic Data This Week

Data Point

Expectation

Release Date

September U.S. Retail Sales

0.3%

11/25/25

September Producer Price Index (PPI) YoY

--

11/25/25

Core PPI YoY

--

11/25/25

Consumer Confidence

93.4

11/25/25

September Durable Goods Orders

0.3%

11/26/25

Source: MarketWatch

 
More Just for You

Want Resources for Your Clients?

Get a version of Weekly Wire you can send directly to your clients. Subscribe to our Weekly Wire newsletter and get a client-friendly version every Monday. Simply download, add your firm's logo, and use with your clients!

The views expressed herein are exclusively those of Orion Portfolio Solutions, LLC d/b/a Brinker Capital Investments, a registered Investment Advisor, and are not meant as investment advice and are subject to change. Information contained herein is derived from sources we believe to be reliable, however, we do not represent that this information is complete or accurate and it should not be relied upon as such. This information is prepared for general information only. It does not have regard to the specific investment objectives, financial situation, and the particular needs of any specific person.

An index is an unmanaged group of assets considered to be representative of a select segment or segments of the market in general, as determined by the index manager for the purposes of managing a specific index. You cannot invest directly in an index.

The CFA® is a globally respected, graduate-level investment credential established in 1962 and awarded by CFA Institute — the largest global association of investment professionals. To learn more about the CFA charter, visit www.cfainstitute.org.

Think2perform’s Behavioral Financial Advice program integrates traditional finance practices with psychology and neuroscience to improve emotional competency and decision-making behavior that increases effective usage of the financial plan with clients. To obtain the Behavioral Financial Advisor (BFA) designation, participants must complete a self-directed course, which takes 20-30 hours to complete, and includes a mix of interactive exercises, videos and case studies. To learn more about the BFA, visit https://www.think2perform.com.

Wealth management services provided by Orion Portfolio Solutions, LLC (“OPS”), a registered investment advisor. Orion OCIO services provided by TownSquare Capital, LLC (“TSC”), a registered investment advisors. OPS and TSC are affiliates and wholly owned subsidiaries of Orion Advisor Solutions, Inc.