Weekly Notes from Tim

By Tim Holland, CFA, Chief Investment Officer

  • One of the things we love about the markets are the maxims…and the ones that are discussed the most exist and persist – we think – because they frame and communicate an historical truth about investing in an easily understood fashion…for example…“Don’t Fight The Fed” reminds us if the Fed is cutting rates that is an historical tailwind for stocks and if the Fed is raising rates that is an historical headwind for stocks. Another maxim, and the subject of this note, is “Sell In May And Go Away” which reminds us there is a seasonal pattern to equity returns, with markets doing better from November through April relative to May through October. 
     
  • Now, Don’t Fight The Fed makes sense as lower interest rates should stimulate the economy – and corporate profits – and support a higher price to earnings multiple, all factors that should push stocks higher, while higher rates should slow the economy and weigh on corporate profits and support a lower price to earnings multiple, all factors that should pull stocks lower. What drives the seasonal nature of US equity returns and underpins Sell In May And Go Away is, in our opinion, less clear. We could call out that new money often goes into stocks early in a new year – as 401K plans and IRAs are funded – a positive for January, February and March, while on the negative side of the return ledger September is the only month, on average, to see the S&P 500 trade lower, and Wall Street portfolio managers leaving their desks for the beach could amplify market volatility, and with it, down days over the summer. 
     
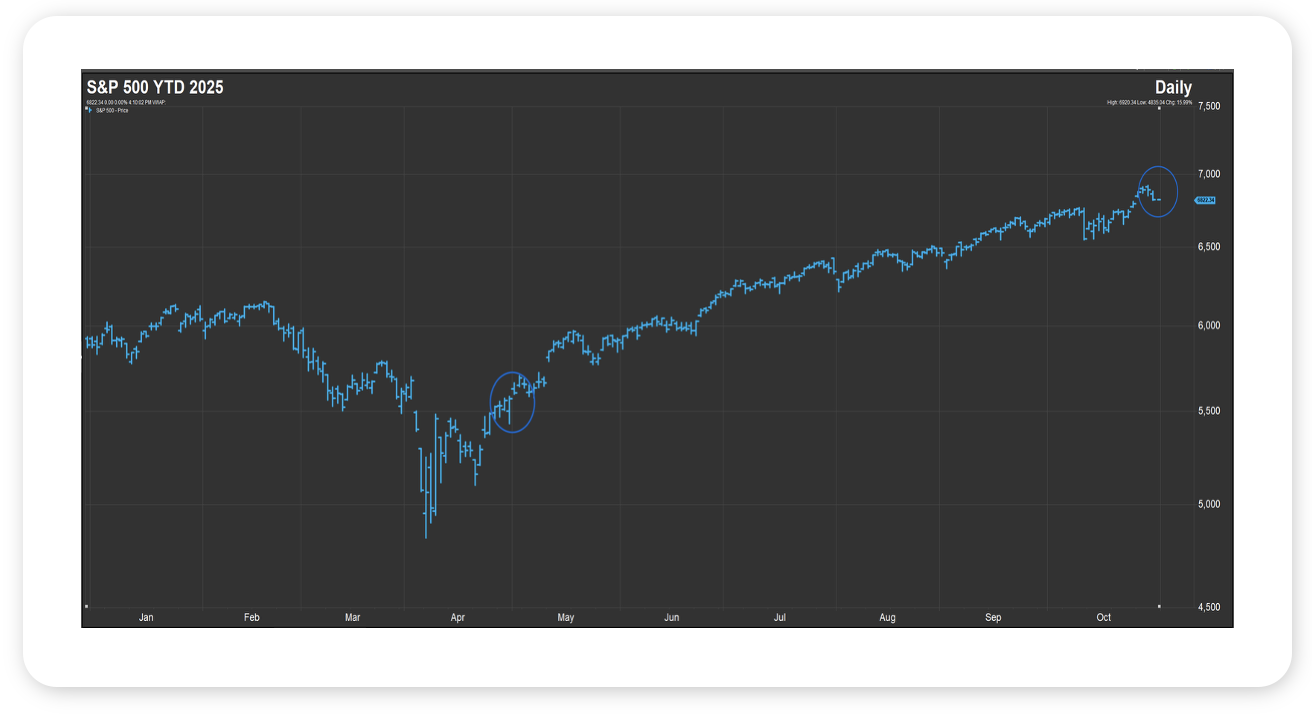
  • Either way, adhering to Sell In May And Go Away wasn’t such a good idea this year, as the S&P 500 returned approximately 23% from the end of April through the end of October (see chart, the period between the circles). As to why stocks rallied over those six months, we see several key catalysts, including better than expected S&P 500 Q2 earnings, enthusiasm for the AI cap ex build out, passage of the OBBBA, clarity on US trade policy and the Federal Reserve cutting interest rates twice. 
     
  • We were cautiously optimistic on the economy and stocks heading into May, and we are cautiously optimistic on the economy and stocks heading into November. 
     
Picture 1

Source: FactSet, October 2025  


Looking Back, Looking Ahead

By Ben Vaske, BFA, Manager, Investment Strategy

Last Week

The Federal Reserve cut its benchmark rate by 25 basis points, as widely expected, to a range of 3.75–4.00%. However, Chair Jerome Powell’s comments struck a more cautious tone. He noted that while inflation remains above target, economic growth and consumer spending are stronger than anticipated, suggesting the Fed may slow the pace of future cuts. Powell also announced that quantitative tightening will end on December 1.

U.S. large caps rose on the week, led by strong technology earnings. All five of the “Mag 7” companies that reported (Microsoft, Meta, Amazon, Alphabet, and Tesla) beat consensus earnings estimates, though MSFT and META sold off modestly afterward. Broader market participation was weak, with Wednesday’s S&P 500 session showing the worst single-day breadth on an up day since 1990: only 104 stocks advanced while 398 declined (Bespoke Investments).

US President Trump and Chinese President Xi met in South Korea and reached several encouraging agreements, including a one-year pause on Chinese export controls, commitments for China to purchase U.S. soybeans, oil, and gas, and a reduction in U.S. tariff rates on Chinese goods. The summit also produced cooperative discussions around semiconductor production and military transparency.

By week’s end, the S&P 500 gained modestly, driven by mega-cap tech. Small caps and value stocks declined, while bond yields rose as the yield curve steepened after the rate cut. Over the full month of October, all major asset classes were positive except U.S. mid caps. Tech and emerging markets continue to lead 2025 equity performance. 
 

This Week

The government shutdown enters its 33rd day, with expectations for its duration now at roughly 46 days (Kalshi). If accurate, that would surpass the record 34-day shutdown from 2018–2019. Nonfarm payrolls are scheduled for release this week, but data may be limited due to the shutdown, leaving ADP private payrolls as the main labor market indicator.

The Fed’s next meeting is on December 10. Markets currently assign a 69% chance of another 25 bp cut at that meeting, down from 92% the week prior. The Atlanta Fed’s GDPNow model continues to project Q3 GDP growth of 3.9%, though the official release remains delayed.
 

We hope you have a great week. If there’s anything we can do to help you, please feel free to reach out to ben.vaske@orion.com or opsresearch@orion.com.
 

Get Your Own Market Commentary

Client-Friendly Weekly Wire

Want a version of Weekly Wire you can send directly to your clients? Subscribe to our Weekly Wire newsletter and get a client-friendly version every Monday. Simply download, add your firm's logo, and use with your clients!


Key Data

Stocks, Bonds, Alternatives, and Real Assets as of October 31, 2025

Security Name

Risk Score

1 Wk

1 Mo

QTD

YTD

1 Yr

3 Yr Ann.

Global Equities (60% US, 40% Intl)

100

0.34%

2.11%

2.11%

21.92%

23.01%

21.68%

S&P 500 Total Return

102

0.72%

2.34%

2.34%

17.52%

21.45%

22.68%

Dow Jones Industrial Average

97

0.75%

2.59%

2.59%

13.34%

15.84%

15.48%

NASDAQ 100 Total Return

122

1.98%

4.81%

4.81%

23.78%

30.95%

32.44%

TV Benchmark

107

1.15%

3.25%

3.25%

18.21%

22.75%

23.53%

Morningstar US Large Cap

102

1.21%

3.09%

3.09%

19.87%

24.75%

25.32%

Morningstar US Mid Cap

113

-1.08%

-0.60%

-0.60%

9.47%

10.95%

14.00%

Morningstar US Small Cap

125

-1.49%

0.25%

0.25%

9.07%

10.14%

12.59%

Morningstar US Value

98

-0.95%

0.05%

0.05%

12.62%

10.90%

13.51%

Morningstar US Growth

126

-0.09%

1.42%

1.42%

17.52%

24.62%

24.29%

MSCI ACWI Ex USA

98

0.00%

2.04%

2.04%

29.22%

25.62%

20.94%

MSCI EAFE

101

-0.45%

1.19%

1.19%

27.21%

23.66%

20.68%

MSCI EM

98

0.89%

4.19%

4.19%

33.59%

28.69%

21.72%

Bloomberg US Agg Bond Index

27

-0.57%

0.62%

0.62%

6.80%

6.16%

5.60%

Bloomberg High Yield Corp Bond Index

41

-0.08%

0.16%

0.16%

7.39%

8.16%

10.20%

Bloomberg Commodity Index

70

0.00%

2.89%

2.89%

12.54%

14.15%

3.06%

Wilshire Liquid Alternative Index

25

-0.06%

0.57%

0.57%

6.28%

5.40%

5.80%

US Dollar

10

0.60%

1.79%

1.79%

-8.26%

-4.30%

-3.50%

Bloomberg US Treasury Bill 1-3mo

1

0.08%

0.37%

0.37%

3.62%

4.44%

4.92%

Source: Morningstar

The TV Benchmark represents an average of the S&P 500, Dow Jones IA, and NASDAQ 100 return indexes. The Orion Risk Score represents risk relative to the global equity market.


Interest Rates as of October 31, 2025

Rate

This Week

1 Wk Δ%

13-Wk Treasury Yield

3.72%

-0.04%

10-Yr Treasury Yield

4.10%

0.10%

Bloomberg US Agg Yield

4.36%

0.10%

Avg Money Mkt Yield

3.92%

0.00%

Avg 30-Yr Mortgage Rate

6.23%

-0.08%

Sources: Yahoo Finance, S&P Global, Crane Data, BankRate


Key Economic Data Last Week

Data Point

Expectation

Actual

Consumer Confidence

93.2

94.6

*Q3 Gross Domestic Product (GDP)

2.8%

DELAYED

*Personal Consumption Expenditures (PCE) YoY

--

DELAYED

Core PCE YoY

--

DELAYED

Source: MarketWatch


Key Economic Data This Week

Data Point

Expectation

Release Date

ISM Manufacturing


11/3/25

*U.S. Trade Deficit


11/4/25

*Job Openings


11/4/25

ADP Employment


11/5/25

ISM Services


11/5/25

*U.S. Employment Report


11/7/25

*U.S. Unemployment Rate


11/7/25

Source: MarketWatch

 
More Just for You

Want Resources for Your Clients?

Get a version of Weekly Wire you can send directly to your clients. Subscribe to our Weekly Wire newsletter and get a client-friendly version every Monday. Simply download, add your firm's logo, and use with your clients!

The views expressed herein are exclusively those of Orion Portfolio Solutions, LLC d/b/a Brinker Capital Investments, a registered Investment Advisor, and are not meant as investment advice and are subject to change. Information contained herein is derived from sources we believe to be reliable, however, we do not represent that this information is complete or accurate and it should not be relied upon as such. This information is prepared for general information only. It does not have regard to the specific investment objectives, financial situation, and the particular needs of any specific person.

An index is an unmanaged group of assets considered to be representative of a select segment or segments of the market in general, as determined by the index manager for the purposes of managing a specific index. You cannot invest directly in an index.

The CFA® is a globally respected, graduate-level investment credential established in 1962 and awarded by CFA Institute — the largest global association of investment professionals. To learn more about the CFA charter, visit www.cfainstitute.org.

Think2perform’s Behavioral Financial Advice program integrates traditional finance practices with psychology and neuroscience to improve emotional competency and decision-making behavior that increases effective usage of the financial plan with clients. To obtain the Behavioral Financial Advisor (BFA) designation, participants must complete a self-directed course, which takes 20-30 hours to complete, and includes a mix of interactive exercises, videos and case studies. To learn more about the BFA, visit https://www.think2perform.com.

Wealth management services provided by Orion Portfolio Solutions, LLC (“OPS”), a registered investment advisor. Orion OCIO services provided by TownSquare Capital, LLC (“TSC”), a registered investment advisors. OPS and TSC are affiliates and wholly owned subsidiaries of Orion Advisor Solutions, Inc.