Weekly Notes from Tim

By Tim Holland, CFA, Chief Investment Officer

  • Last week was was one of those weeks where several big datapoints landed on Wall Street, but one datapoint mattered more.
     
  • On Sunday, we got news of a US / EU trade deal that puts a 15% tariff on European exports. The US and EU traded $975 billion worth of goods in 2024, so trade certainty between the two is a meaningful positive. And on Wednesday, we learned that the US economy grew 3% in Q2. The positive, and better than expected, report was welcome following a Q1 GDP print of negative 0.50%. Both datapoints mattered and were well received by Wall Street.
     
  • Then on Friday, we got a jobs report that showed the US created just 73,000 jobs last month, well below the 115,000 investors expected, while jobs numbers for June and May were revised lower. The report raised immediate concerns about the health of the US consumer and economy, and saw investors move away from stocks and buy bonds, with the yield on the US 10 Year Note falling 12 basis points on Friday. The July jobs report mattered and mattered more to Wall Street.
     
  • It also had Wall Street reconsidering the path forward for interest rates. After Fed Chairman Powell declined to tee up a September rate cut following the Fed’s meeting on July 30th, Wall Street’s expectations went from a rate cut to the Fed standing pat next month (see first chart). Following the weak July jobs report, Wall Street reconsidered the path forward for rates once again and is now expecting a quarter point cut in September (see second chart). The August jobs report will be released on September 5th, twelve days ahead of the Fed’s September meeting. It will probably be a datapoint that matters more. 
     
CME Group Target Rate Possibilities July 2025

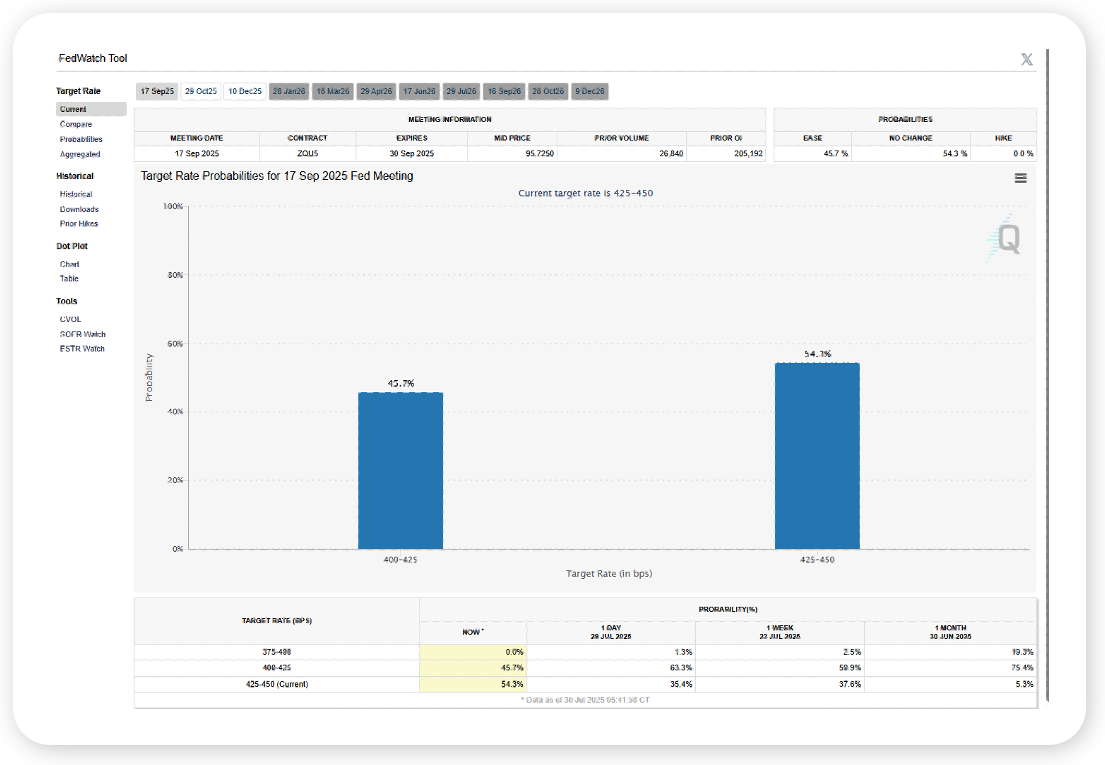
Source: CME Group, July 2025 


CME Group Target Rate Possibilities August 2025

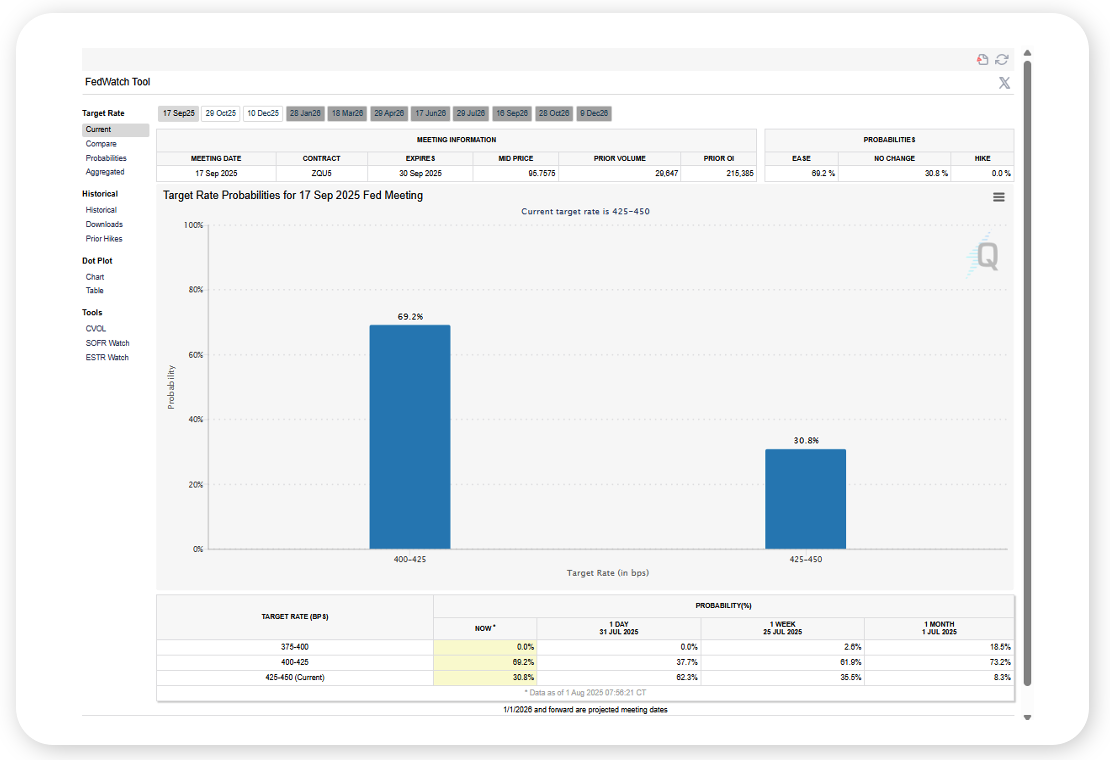
Source: CME Group, August 2025


Looking Back, Looking Ahead

By Ben Vaske, BFA, Manager, Investment Strategy

Last Week

It was a heavy week for economic data, with GDP, labor, inflation, and the Fed’s interest rate decision all in focus. Results painted a mixed picture of the economy. The S&P 500 declined for four consecutive days, with the sharpest drop coming Friday after a much weaker-than-expected nonfarm payrolls report.

Geopolitical tensions also resurfaced, as the U.S. deployed nuclear submarines in response to “provocative” comments from Russia, adding a layer of caution to already unsettled markets.

On the data front, Q2 GDP came in at 3.0% versus 2.3% expected, boosted primarily by a sharp reversal in net exports. However, most core components, including consumption and business investment, remain below one- and three-year averages. Personal income rose 0.3% in June, while personal consumption matched that pace. PCE inflation, the Fed’s preferred gauge, rose 0.3% in June, with the year-over-year rate ticking up to 2.6% from 2.4% in May, largely reflecting last year’s unusually soft inflation readings rolling out of the data.

Labor data disappointed. Nonfarm payrolls increased by just 73,000 versus 104,000 expected, and prior months were revised down by a combined 258,000, resulting in a net loss of 185,000 jobs including revisions. The unemployment rate edged up to 4.2%. The ISM Manufacturing Index fell to 48.0 in July, its fifth consecutive month in contraction territory, underscoring the drag from trade-related uncertainty.

Q2 earnings remain a bright spot. With 66% of S&P 500 companies reporting, 82% have posted positive EPS surprises and 79% have beaten on revenue. Earnings growth is running at 10.3%, well above the 4.9% estimate from June 30, with strength in communication services, financials, and consumer discretionary.
 

This Week

The coming week is quieter for economic data. The U.S. trade balance is expected to show a second straight month of surplus, while markets will closely watch for any reaction as broad U.S. tariffs on roughly 67 countries are set to resume Thursday, August 7.

On the policy front, rate cut expectations have shifted sharply. Following the weak labor report, futures now imply an 80% probability of a September cut, up from under 40% earlier last week. Markets are now pricing in two to three cuts by year-end.

Earnings season continues, but the heaviest reporting period is now behind us.


We hope you have a great week. If there’s anything we can do to help you, please feel free to reach out to ben.vaske@orion.com or opsresearch@orion.com.
 

Get Your Own Market Commentary

Client-Friendly Weekly Wire

Want a version of Weekly Wire you can send directly to your clients? Subscribe to our Weekly Wire newsletter and get a client-friendly version every Monday. Simply download, add your firm's logo, and use with your clients!


Key Data

Stocks, Bonds, Alternatives, and Real Assets as of August 1, 2025

Security Name

Risk Score

1 Wk

1 Mo

QTD

YTD

1 Yr

3 Yr Ann.

Global Equities (60% US, 40% Intl)

100

-2.51%

0.04%

0.07%

11.02%

16.13%

14.92%

S&P 500 Total Return

102

-2.34%

0.72%

0.61%

6.85%

16.06%

16.59%

Dow Jones Industrial Average

97

-2.92%

-1.96%

-1.07%

3.43%

9.93%

12.14%

NASDAQ 100 Total Return

122

-2.17%

1.30%

0.41%

8.79%

21.42%

21.72%

TV Benchmark

107

-2.48%

0.02%

-0.02%

6.36%

15.80%

16.82%

Morningstar US Large Cap

102

-2.13%

1.12%

0.70%

7.42%

17.72%

18.39%

Morningstar US Mid Cap

113

-3.08%

-0.52%

0.19%

5.41%

12.56%

10.85%

Morningstar US Small Cap

125

-3.28%

-0.54%

0.50%

1.26%

5.63%

8.54%

Morningstar US Value

98

-3.11%

-2.49%

-1.17%

4.59%

6.45%

10.93%

Morningstar US Growth

126

-1.52%

2.56%

1.22%

9.73%

24.13%

16.65%

MSCI ACWI Ex USA

98

-2.86%

-1.12%

-0.95%

17.19%

15.85%

12.68%

MSCI EAFE

101

-3.13%

-1.78%

-1.76%

17.81%

14.80%

13.61%

MSCI EM

98

-2.47%

0.06%

0.62%

16.29%

15.92%

10.46%

Bloomberg US Agg Bond Index

27

0.95%

0.59%

0.55%

4.59%

3.79%

1.75%

Bloomberg High Yield Corp Bond Index

41

-0.16%

0.24%

0.32%

4.90%

8.53%

7.85%

Bloomberg Commodity Index

70

-2.67%

-1.15%

-1.00%

4.48%

10.13%

-1.04%

Wilshire Liquid Alternative Index

25

-0.43%

-0.06%

-0.01%

2.71%

2.83%

3.90%

US Dollar

10

1.53%

2.40%

2.34%

-8.61%

-5.06%

-2.04%

Bloomberg US Treasury Bill 1-3mo

1

0.08%

0.40%

0.41%

2.54%

4.69%

4.77%

Source: Morningstar

The TV Benchmark represents an average of the S&P 500, Dow Jones IA, and NASDAQ 100 return indexes. The Orion Risk Score represents risk relative to the global equity market.


Interest Rates as of August 1, 2025

Rate

This Week

1 Wk Δ%

13-Wk Treasury Yield

4.18%

-0.07%

10-Yr Treasury Yield

4.22%

-0.17%

Bloomberg US Agg Yield

4.54%

-0.16%

Avg Money Mkt Yield

4.12%

0.01%

Avg 30-Yr Mortgage Rate

6.78%

-0.01%

Sources: Yahoo Finance, S&P Global, Crane Data, BankRate


Key Economic Data Last Week

Data Point

Expectation

Actual

Consumer Confidence

95.2

97.2

Job Openings

7.5M

7.4M

ADP Employment 

64,000

104,000

Q2 GDP

2.3%

3.0

Federal Reserve Interest Rate Decision

No Change

No Change

Personal Consumption Expenditures (PCE) YoY

2.5%

2.6%

Core PCE YoY

2.7%

2.8%

US Unemployment Rate

4.2%

4.2%

Nonfarm Payrolls

102,000

73,000

ISM Manufacturing

49.5%

48.0%

Source: MarketWatch


Key Economic Data This Week

Data Point

Expectation

Release Date

US Trade Deficit

+$61.0B

8/5/25

ISM Services

51.1%

8/5/25

Initial Jobless Claims

221,000

8/7/25

Consumer Credit

--

8/7/25

Source: MarketWatch

 
More Just for You

Want Resources for Your Clients?

Get a version of Weekly Wire you can send directly to your clients. Subscribe to our Weekly Wire newsletter and get a client-friendly version every Monday. Simply download, add your firm's logo, and use with your clients!

The views expressed herein are exclusively those of Orion Portfolio Solutions, LLC d/b/a Brinker Capital Investments, a registered Investment Advisor, and are not meant as investment advice and are subject to change. Information contained herein is derived from sources we believe to be reliable, however, we do not represent that this information is complete or accurate and it should not be relied upon as such. This information is prepared for general information only. It does not have regard to the specific investment objectives, financial situation, and the particular needs of any specific person.

An index is an unmanaged group of assets considered to be representative of a select segment or segments of the market in general, as determined by the index manager for the purposes of managing a specific index. You cannot invest directly in an index.

The CFA® is a globally respected, graduate-level investment credential established in 1962 and awarded by CFA Institute — the largest global association of investment professionals. To learn more about the CFA charter, visit www.cfainstitute.org.

Think2perform’s Behavioral Financial Advice program integrates traditional finance practices with psychology and neuroscience to improve emotional competency and decision-making behavior that increases effective usage of the financial plan with clients. To obtain the Behavioral Financial Advisor (BFA) designation, participants must complete a self-directed course, which takes 20-30 hours to complete, and includes a mix of interactive exercises, videos and case studies. To learn more about the BFA, visit https://www.think2perform.com.

Wealth Management services offered through Orion Portfolio Solutions, LLC d/b/a Brinker Capital Investments a registered investment advisor.