Our investment team is closely monitoring the developments in the Middle East and the impact they are having on commodity prices, the stock market, and the world economy. We lament the loss of innocent life, pray for the safety of U.S. troops in harm’s way and mourn the U.S. military servicemembers who have lost their lives. 

You will continue to hear from us on the conflict with Iran. In the meantime, if you have any questions on the markets and the economy or if there is anything we can do to support you and your clients during this difficult time, please reach out to us via our Investment Strategy Team’s email address at opsresearch@orion.com

Weekly Notes from Tim

By Tim Holland, CFA, Chief Investment Officer

  • We have written often about the remarkable impact hydraulic fracturing or “fracking” has had on America’s energy profile, about how the U.S. went from pumping 4.7 million barrels of oil a day in 2008 to pumping 13.8 million barrels of oil a day in 2025; about how the U.S. went from being a net importer of 13 million barrels of oil and petroleum products a day in 2005 to being a net exporter of 3.8 million barrels of oil and petroleum products a day in 2025, and about how the US went from being a net importer of 3.8 trillion cubic feet of natural gas in 2007 to being a net exporter of 5.7 trillion cubic feet of natural gas in 2025.
     
  • America’s evolved energy profile would be a big deal for our economy, national security and international standing at any point in time; it strikes us as a particularly big deal given the war in the Middle East and the closing of the Strait of Hormuz, the waterway through which 20 million barrels of oil used to travel daily, or roughly 25% of all seaborne oil trade, mostly destined for markets in Asia. And as access to Middle Eastern oil is curtailed, the world is turning to U.S. oil to meet its energy needs. More specifically, according to the U.S. Energy Information Administration, in mid-April U.S. oil exports hit a record 12.9 million barrels a day (see chart). While it is unlikely that U.S. energy companies will hold onto all their recent market share gains as the war winds down, it is likely they will hold onto some of those market share gains, giving the U.S. a more prominent role in global energy markets going forward.
     
  • We were all aware of our country’s economic and geo-political advantages before the war with Iran….the U.S. as home to the world’s largest economy, the world’s largest and most liquid equity and fixed income markets and the world’s most powerful military; the U.S. with oceans on either side of it and friendly neighbors above and below it; a U.S. economy driven by domestic consumption and not external demand; the U.S. as the printer of the world’s reserve currency and the U.S. as the world’s leading producer of oil and natural gas. The war has only amplified those advantages we think, particularly as it concerns energy.

     
    Picture1


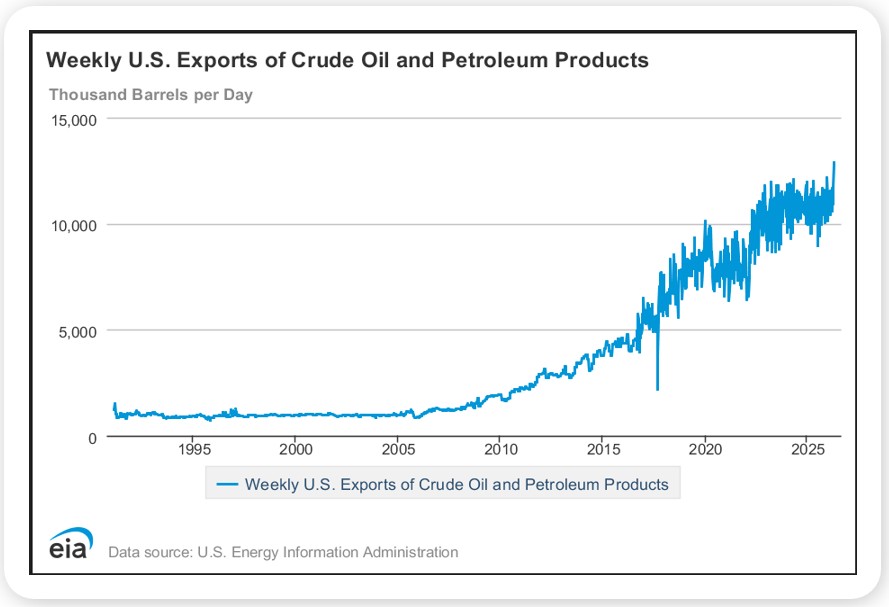
Source, U.S. Energy Information Administration, April 2026


Looking Back, Looking Ahead

By Ben Vaske, BFA, Manager, Investment Strategy

Last Week

Markets extended their recent run of strength last week, with the S&P 500, NASDAQ, and Dow all reaching new all-time highs and the S&P 500 posting a gain of roughly 1% on the week. The S&P 500 and NASDAQ 100 have now been positive for five consecutive weeks and sit up 6% and 10% year-to-date, respectively, despite a challenging start to the year. The broader rally over the last three years has delivered exceptional returns for balanced, diversified investors, led by U.S. technology stocks.

Earnings season was a major driver of sentiment, as blowout results from several Magnificent 7 names sent Q1 earnings growth estimates surging to 27% year-over-year, which would be the strongest pace of growth since Q4 2021. With 63% of S&P 500 companies having reported, 84% have beaten earnings expectations and 81% have topped revenue estimates. On the economic front, data was mixed: GDP came in slightly below expectations at 2.0% annualized growth, PCE inflation ticked higher to 3.5% year-over-year, and the Fed held interest rates steady at its April meeting amid the highest level of internal dissent in decades.

Performance across asset classes was broadly constructive. Interest rates edged slightly higher, keeping the Bloomberg Agg close to flat on the year, and the U.S. dollar fell sharply for the second consecutive week, providing a tailwind to developed international equities. Emerging markets remain the top-performing equity class in 2026.


This Week

Employment data takes center stage this week, with ADP on Wednesday and the government's jobs report on Friday. Current expectations call for roughly 53,000 jobs added and no change to the unemployment rate at 4.3%. Earnings season remains active as well as we continue through some of the heaviest weeks of this quarter’s releases. Notable names this week include Palantir, Advanced Micro Devices, and a number of software companies.

We hope you have a great week. If there’s anything we can do to help you, please feel free to reach out to ben.vaske@orion.com or opsresearch@orion.com.
 

Get Your Own Market Commentary

Client-Friendly Weekly Wire

Want a version of Weekly Wire you can send directly to your clients? Subscribe to our Weekly Wire newsletter and get a client-friendly version every Monday. Simply download, add your firm's logo, and use with your clients!


Key Data

Stocks, Bonds, Alternatives, and Real Assets as of May 1, 2026

Security Name

Risk Score

1 Wk

1 Mo

QTD

YTD

1 Yr

3 Yr Ann.

Global Equities (60% US, 40% Intl)

100

0.78%

8.34%

10.42%

7.49%

32.04%

20.35%

S&P 500 Total Return

102

0.92%

10.03%

10.82%

6.02%

30.62%

21.82%

Dow Jones Industrial Average

97

0.55%

6.39%

6.90%

3.49%

23.53%

15.40%

NASDAQ 100 Total Return

122

1.50%

15.38%

16.75%

9.96%

41.00%

28.93%

TV Benchmark

107

0.99%

10.60%

11.49%

6.49%

31.71%

22.05%

Morningstar US Large Cap

102

1.02%

10.95%

11.79%

5.00%

31.74%

23.60%

Morningstar US Mid Cap

113

0.76%

7.63%

8.32%

9.64%

25.47%

16.32%

Morningstar US Small Cap

125

0.05%

6.77%

7.46%

7.47%

31.01%

15.85%

Morningstar US Value

98

0.88%

2.52%

2.39%

5.49%

23.88%

15.67%

Morningstar US Growth

126

-0.91%

11.48%

12.53%

5.56%

28.06%

21.56%

MSCI ACWI Ex USA

98

0.51%

6.04%

9.98%

9.32%

33.91%

18.15%

MSCI EAFE

101

1.00%

3.97%

7.92%

6.72%

26.63%

16.09%

MSCI EM

98

-0.52%

10.06%

14.82%

14.70%

47.73%

21.32%

Bloomberg US Agg Bond Index

27

-0.39%

0.21%

0.22%

0.18%

4.52%

3.84%

Bloomberg High Yield Corp Bond Index

41

0.05%

1.45%

1.83%

1.33%

8.77%

8.94%

Bloomberg Commodity Index

70

3.09%

4.53%

4.00%

29.40%

44.65%

15.90%

Wilshire Liquid Alternatives 

25

0.25%

2.06%

2.06%

2.09%

9.93%

6.17%

MSCI US REIT

104

1.15%

8.12%

8.81%

14.07%

19.02%

12.20%

US Dollar

10

-0.72%

-1.91%

-1.91%

-0.27%

-1.42%

-1.20%

Bloomberg US Treasury Bill 1-3mo

1

0.07%

0.33%

0.33%

1.22%

4.09%

4.82%

Source: Morningstar

The TV Benchmark represents an average of the S&P 500, Dow Jones IA, and NASDAQ 100 return indexes. The Orion Risk Score represents risk relative to the global equity market.


Interest Rates as of May 1, 2026

Rate

This Week

1 Wk Δ%

13-Wk Treasury Yield

3.58%

-0.02%

10-Yr Treasury Yield

4.38%

0.07%

Bloomberg US Agg Yield

4.59%

0.07%

Avg Money Mkt Yield

3.47%

0.00%

Avg 30-Yr Mortgage Rate

6.32%

-0.04%

Sources: Yahoo Finance, S&P Global, Crane Data, BankRate


Key Economic Data Last Week

Data Point

Expectation

Actual

Consumer Confidence

89.0

92.8

Durable Goods Order

0.2%

0.8%

Housing Starts

1.36M

1.36M

FOMC Interest Rate Decisions

Hold

Hold

Q1 GDP

2.2%

2.0%

Personal Consumption Expenditures (PCE) YoY 

3.5%

3.5%

Core PCE YoY

3.2%

3.2%

US Leading Economic Indicators

-0.1%

-0.6%

ISM Manufacturing 

53.0

52.7

Source: MarketWatch


Key Economic Data This Week

Data Point

Expectation

Release Date

U.S. Trade Balance

-$60.4B

5/5/2026

Hew Home Sales

660,000

5/5/2026

ISM Services

54.3%

5/5/2026

ADP Employment

98,000

5/6/2026

U.S. Productivity

1.5%

5/7/2026

U.S. Employment Report

53,000

5/8/2026

U.S Unemployment Rate

4.3%

5/8/2026

U.S. Hourly Wages YoY

3.8%

5/8/2026

Source: MarketWatch

 
More Just for You

Want Resources for Your Clients?

Get a version of Weekly Wire you can send directly to your clients. Subscribe to our Weekly Wire newsletter and get a client-friendly version every Monday. Simply download, add your firm's logo, and use with your clients!

The views expressed herein are exclusively those of Orion Portfolio Solutions, LLC d/b/a Brinker Capital Investments, a registered Investment Advisor, and are not meant as investment advice and are subject to change. Information contained herein is derived from sources we believe to be reliable, however, we do not represent that this information is complete or accurate and it should not be relied upon as such. This information is prepared for general information only. It does not have regard to the specific investment objectives, financial situation, and the particular needs of any specific person.

An index is an unmanaged group of assets considered to be representative of a select segment or segments of the market in general, as determined by the index manager for the purposes of managing a specific index. You cannot invest directly in an index.

The CFA® is a globally respected, graduate-level investment credential established in 1962 and awarded by CFA Institute — the largest global association of investment professionals. To learn more about the CFA charter, visit www.cfainstitute.org.

Think2perform’s Behavioral Financial Advice program integrates traditional finance practices with psychology and neuroscience to improve emotional competency and decision-making behavior that increases effective usage of the financial plan with clients. To obtain the Behavioral Financial Advisor (BFA) designation, participants must complete a self-directed course, which takes 20-30 hours to complete, and includes a mix of interactive exercises, videos and case studies. To learn more about the BFA, visit https://www.think2perform.com.

Wealth management services provided by Orion Portfolio Solutions, LLC (“OPS”), a registered investment advisor. Orion OCIO services provided by TownSquare Capital, LLC (“TSC”), a registered investment advisors. OPS and TSC are affiliates and wholly owned subsidiaries of Orion Advisor Solutions, Inc.