


Our investment team is closely monitoring the developments in the Middle East and the impact they are having on commodity prices, the stock market, and the world economy. We lament the loss of innocent life, pray for the safety of U.S. troops in harm’s way and mourn the U.S. military servicemembers who have lost their lives.
You will continue to hear from us on the conflict with Iran. In the meantime, if you have any questions on the markets and the economy or if there is anything we can do to support you and your clients during this difficult time, please reach out to us via our Investment Strategy Team’s email address at opsresearch@orion.com.
Weekly Notes from Tim
By Tim Holland, CFA, Chief Investment Officer
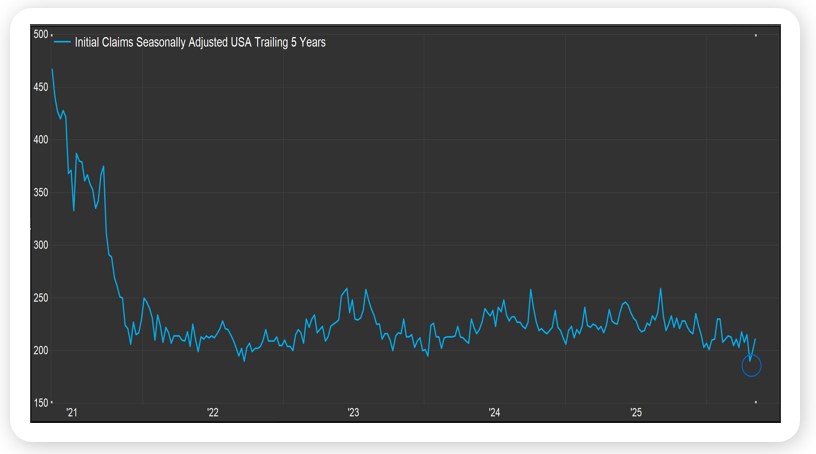
- I was fortunate to participate in an Orion strategic planning meeting last week where the conversation focused on how Orion can better support and serve our clients. It was a productive few days, and it was great to connect with so many colleagues from across the country. It was also a fun few days, as we discussed, over dinner, our favorite actors, shows and movies, and singers and songs of our youth, with one of us offering up the Brian Adams classic, Summer of ’69, which was fortunate as I was hoping to write about initial jobless claims this week, and how they recently came in at, well, the lowest level since the Summer of 1969.
- Weekly Initial claims for unemployment insurance collected by the Department of Labor are one of the most timely datapoints we have on the health of the US labor market. At the risk of stating the very obvious, a rising number should speak to more folks losing their job and a falling number should speak to more folks finding a job, or at least keeping their job (I believe the unemployment rate and the nonfarm payrolls report do carry more weight with Wall Street than the initial claims data, but as both those datapoints are released on a monthly basis I would argue that information is a bit stale relative to the weekly initial claims data).
- As we’ve had to navigate the war in the Middle East, a spike in oil prices, elevated inflation and inflation expectations and the ongoing adoption of AI and its potential impact on corporate hiring plans, investors have been rightly worried about the labor market and the US economy (as you know, US GDP is 70% consumption driven, so if the labor market is in trouble, the US economy could be as well). Fortunately, the weekly claims data has been very bullish of late, with 189,000 Americans filing for unemployment insurance the week of April 25th, well below Wall Street’s expectations and the lowest number since September 1969 (see chart; we are not minimizing the fact that 189,000 of our fellow Americans filed for unemployment insurance a few weeks ago, just trying to understand what the datapoint says about the US economy). To put the report in context, America’s population is just shy of 350 million compared to 202 million in late 1969.
- All things being equal, a strong jobs market should mean a strong economy, which should mean strong corporate profits and higher stock prices over time.
Source, FactSet, May 2026
Looking Back, Looking Ahead
By Ben Vaske, BFA, Manager, Investment Strategy
Last Week
Equity markets took a breather from their outsized winning streak last week as a pair of hotter-than-expected inflation reports reminded investors that the path back to the Fed's 2% target remains anything but straight. The S&P 500 eked out a modest 0.2% gain while small caps and emerging markets fell roughly 2.5% each. International equities also lost ground, with developed markets off around 1.5% to 1.8%, suggesting some short-term profit-taking after a strong run. Commodities were the week's standout, rising 1.9% and extending the Bloomberg Commodity Index's year-to-date gain to over 30%, with WTI crude oil now trading near $106 per barrel, roughly 71% above where it stood when the Iran conflict began.
On the inflation front, CPI rose 0.6% in April and is now up 3.8% year-over-year, while PPI rose 1.4% for the month and 6.0% over the past 12 months, its fastest pace in more than four years. Energy prices were the primary culprit, though pricing pressures proved broader than oil alone. The 10-year Treasury yield responded, spiking to 4.6% on the week.
Friday also marked Jerome Powell's final day as Fed Chair, with Kevin Warsh now confirmed and stepping into the role ahead of the June 17th FOMC meeting. Notably, Powell will remain on the Board of Governors as a voting member, adding a layer of complexity to the transition.
This Week
All eyes will be on NVIDIA Wednesday evening, when the world's largest company by market cap reports earnings after the bell. With Magnificent 7 names having delivered exceptional results throughout this earnings season, the bar is high. NVIDIA's report has historically had the ability to move broader markets, and at 8.2% of the S&P 500, the stakes are particularly significant.
The economic calendar is lighter this week, with consumer sentiment the marquee release on Friday. Sentiment has been hovering near multi-decade lows, so any meaningful shift in either direction will be worth watching.
We hope you have a great week. If there’s anything we can do to help you, please feel free to reach out to ben.vaske@orion.com or opsresearch@orion.com.