Weekly Notes from Tim

By Tim Holland, CFA, Chief Investment Officer

  • As the word peg features importantly in this week’s note, we went looking for an entertaining (well, hopefully entertaining) way to introduce it…we didn’t find much to work with…there don’t seem to be many famous folks named, Peg (the late singer Peggy Lee likely tops the list); there are well known sayings built around the word including “a square peg in a round hole” but connecting those dots was a stretch; and the Steely Dan song “Peg,” seemed too niche…so, panicked, we pivoted where we have so many times before: 1980’s movies, specifically “Vision Quest,” where high school wrestler Louden Swain (played by Matthew Modine – Dr. Martin Brenner for you “Stranger Things” fans) scales the gym’s peg board while John Waite’s classic song “Change” blares (the movie soundtrack is stellar).
     
  • Most of us are familiar with the Price To Earnings Ratio or P/E Ratio, which measures a company’s share price relative to its annual earnings (if a stock is priced at $10 and is producing $1.00 in earnings per share, its P/E Ratio is 10x). The P/E Ratio is an easy way to determine if a company represents good value (a low P/E should indicate an attractively priced stock while a high P/E should indicate an expensively priced stock). The problem with the P/E Ratio as a valuation tool is it provides no context – a low P/E stock could have dismal growth prospects while a high P/E stock could have phenomenal growth prospects. Enter the “PEG Ratio” which looks at a company’s Price To Earnings Ratio relative to its Earnings Growth Rate (the math is P/E Ratio divided by Annual EPS Growth). Popularized by legendary portfolio manager Peter Lynch, the PEG Ratio can help determine if a stock’s price is justified by its earnings growth – a fairly valued company should have a PEG Ratio of 1; an overvalued company a PEG Ratio above 1 and an undervalued company a PEG Ratio under 1. The same math holds for stock indices.
     
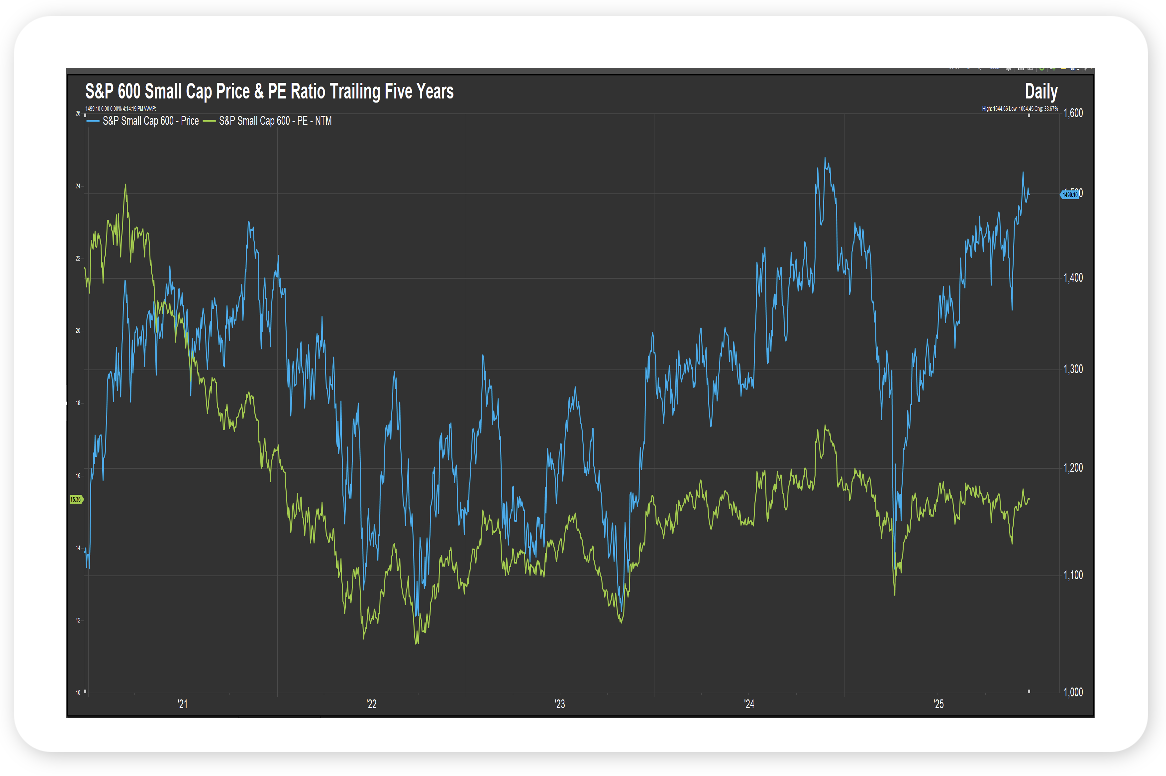
  • We have written often of late of the attractiveness of US small cap stocks. To make that case once again, consider that the S&P 600 Small Cap Index is trading at approximately 15x its expected next twelve-month earnings (see chart, yellow line) while Wall Street sees the index’s earnings growing 16% through 2027, giving the index a PEG Ratio of approximately 0.9, indicating the S&P 600 Small Cap Index is attractively priced relative to its expected earnings growth.
     
  • And as we say goodbye to 2025, we would like to wish you and your loved ones a Happy, Healthy & Prosperous New Year!!!
     
Picture 1

Source: FactSet, December 2025


Looking Back, Looking Ahead

By Ben Vaske, BFA, Manager, Investment Strategy

Last Week

Markets closed out the holiday shortened week with solid gains despite being shut for 1.5 days around Christmas. Broad asset classes finished higher, including stocks, bonds, real assets, and alternatives, reflecting constructive year end momentum.

Economic data surprised to the upside. Q3 GDP was finally released and came in well above expectations at 4.3% versus 3.2% expected. Growth was driven primarily by strong personal consumption and net exports. Core Real GDP, which strips out more volatile components, grew at a still healthy 3.0% annualized pace.

Performance leadership remained global. Commodities, emerging markets, and U.S. large caps led gains on the week. For the year, international equities continue to dominate. 
Emerging markets are up 34% YTD, developed markets are up 33%, while the NASDAQ 100 has gained about 23%. Globally diversified portfolios are on track to finish 2025 on a strong note despite elevated volatility throughout the year.

Precious metals stayed in focus. Silver surged over the weekend and now represents more than $4.6 trillion in global value, surpassing NVIDIA as the second most valuable asset behind gold. Silver, platinum, and gold have all outperformed U.S. equity benchmarks by wide margins during the current bull market.
 

This Week

It is another shortened holiday week. Markets will be closed Thursday for New Year’s Day, while New Year’s Eve will be a full trading session. With a light economic and earnings calendar, volatility is expected to remain muted.

The main event will be the release of minutes from the December FOMC meeting on Tuesday, which may offer additional insight into the Fed’s thinking following its recent rate cut. Markets currently assign an 82% probability that the Fed holds rates steady at its January 28 meeting.

We hope you have a great week. If there’s anything we can do to help you, please feel free to reach out to ben.vaske@orion.com or opsresearch@orion.com.
 

Get Your Own Market Commentary

Client-Friendly Weekly Wire

Want a version of Weekly Wire you can send directly to your clients? Subscribe to our Weekly Wire newsletter and get a client-friendly version every Monday. Simply download, add your firm's logo, and use with your clients!


Key Data

Stocks, Bonds, Alternatives, and Real Assets as of December 26, 2025

Security Name

Risk Score

1 Wk

1 Mo

QTD

YTD

1 Yr

3 Yr Ann.

Global Equities (60% US, 40% Intl)

100

1.40%

2.42%

4.28%

24.51%

22.63%

21.02%

S&P 500 Total Return

102

1.41%

1.83%

3.91%

19.32%

16.26%

23.46%

Dow Jones Industrial Average

97

1.20%

2.90%

5.43%

16.47%

14.37%

15.81%

NASDAQ 100 Total Return

122

1.18%

1.67%

4.07%

22.91%

18.64%

33.71%

TV Benchmark

107

1.26%

2.13%

4.47%

19.57%

16.42%

24.33%

Morningstar US Large Cap

102

1.51%

1.71%

4.23%

21.19%

17.77%

26.21%

Morningstar US Mid Cap

113

0.98%

2.07%

1.46%

11.74%

9.74%

14.37%

Morningstar US Small Cap

125

0.46%

2.89%

5.13%

14.38%

12.32%

15.23%

Morningstar US Value

98

1.10%

2.64%

5.09%

18.29%

17.06%

14.69%

Morningstar US Growth

126

1.38%

2.15%

0.56%

16.51%

12.62%

25.84%

MSCI ACWI Ex USA

98

1.52%

3.36%

5.07%

33.05%

33.06%

17.95%

MSCI EAFE

101

1.20%

3.66%

4.95%

31.94%

32.50%

17.85%

MSCI EM

98

2.14%

2.15%

4.23%

33.64%

32.57%

16.83%

Bloomberg US Agg Bond Index

27

0.21%

-0.26%

1.11%

7.31%

7.42%

4.44%

Bloomberg High Yield Corp Bond Index

41

0.16%

0.57%

1.10%

8.40%

8.47%

9.64%

Bloomberg Commodity Index

70

3.45%

3.90%

8.48%

18.65%

19.59%

4.92%

Wilshire Liquid Alternative Index

25

0.35%

-0.08%

0.93%

6.66%

6.02%

5.73%

MSCI US REIT

104

1.07%

-1.55%

-1.26%

3.39%

2.83%

8.42%

US Dollar

10

-0.46%

-1.69%

0.21%

-9.69%

-9.50%

-2.07%

Bloomberg US Treasury Bill 1-3mo

1

0.07%

0.35%

0.98%

4.25%

4.32%

4.93%

Source: Morningstar

The TV Benchmark represents an average of the S&P 500, Dow Jones IA, and NASDAQ 100 return indexes. The Orion Risk Score represents risk relative to the global equity market.


Interest Rates as of December 26, 2025

Rate

This Week

1 Wk Δ%

13-Wk Treasury Yield

3.54%

0.02%

10-Yr Treasury Yield

4.14%

-0.01%

Bloomberg US Agg Yield

4.32%

-0.01%

Avg Money Mkt Yield

3.57%

-0.01%

Avg 30-Yr Mortgage Rate

6.28%

-0.01%

Sources: Yahoo Finance, S&P Global, Crane Data, BankRate


Key Economic Data Last Week

Data Point

Expectation

Actual

Third Quarter GDP (Delayed Report)

3.2%

4.3%

Durable Goods Orders (Delayed Report)

-1.2%

-2.2%

Consumer Confidence

92.9

89.1

Source: MarketWatch


Key Economic Data This Week

Data Point

Expectation

Release Date

Pending Home Sales

--

12/29/25

S&P Case-Shiller Home Price Index

--

12/30/25

Chicago Business Barometer

--

12/30/25

Source: MarketWatch

 
More Just for You

Want Resources for Your Clients?

Get a version of Weekly Wire you can send directly to your clients. Subscribe to our Weekly Wire newsletter and get a client-friendly version every Monday. Simply download, add your firm's logo, and use with your clients!

The views expressed herein are exclusively those of Orion Portfolio Solutions, LLC d/b/a Brinker Capital Investments, a registered Investment Advisor, and are not meant as investment advice and are subject to change. Information contained herein is derived from sources we believe to be reliable, however, we do not represent that this information is complete or accurate and it should not be relied upon as such. This information is prepared for general information only. It does not have regard to the specific investment objectives, financial situation, and the particular needs of any specific person.

An index is an unmanaged group of assets considered to be representative of a select segment or segments of the market in general, as determined by the index manager for the purposes of managing a specific index. You cannot invest directly in an index.

The CFA® is a globally respected, graduate-level investment credential established in 1962 and awarded by CFA Institute — the largest global association of investment professionals. To learn more about the CFA charter, visit www.cfainstitute.org.

Think2perform’s Behavioral Financial Advice program integrates traditional finance practices with psychology and neuroscience to improve emotional competency and decision-making behavior that increases effective usage of the financial plan with clients. To obtain the Behavioral Financial Advisor (BFA) designation, participants must complete a self-directed course, which takes 20-30 hours to complete, and includes a mix of interactive exercises, videos and case studies. To learn more about the BFA, visit https://www.think2perform.com.

Wealth management services provided by Orion Portfolio Solutions, LLC (“OPS”), a registered investment advisor. Orion OCIO services provided by TownSquare Capital, LLC (“TSC”), a registered investment advisors. OPS and TSC are affiliates and wholly owned subsidiaries of Orion Advisor Solutions, Inc.