Weekly Notes from Tim

By Tim Holland, CFA, Chief Investment Officer

  • On November 8, 2021, the S&P 500 changed hands at 4,701; today it trades at 6,605.  
     
  • On November 8, 2021, the Nasdaq Composite changed hands at 15,982; today it trades at 22,385.  
     
  • On November 8, 2021, the Russell 2000, the benchmark for US small cap stocks, changed hands at 2,458; today it trades at 2,411 (all data as of 9/25/2025).  
     
  • Where are we headed with this week’s note? As you know, on September 18th the Russell 2000 hit 2,470, registering its first all-time high since trading at 2,458 in 2021. So, in In the span of nearly four calendar years, the S&P 500 and the Nasdaq gave investors gains of 40%+, while the Russell 2000 cost you a few points.. Why? Most see economic uncertainty – due to the pandemic and US trade policy – and higher borrowing costs as the reasons for small cap underperformance. Consider that in November of 2021, the Fed Funds Rate was essentially 0% and the yield on the US 10 Year Note was 1.5%; then, as inflation took hold and the Federal Reserve began rapidly raising rates to break the back of said inflation, the former rose to 5.3% and the latter to 5%, as we moved through 2023.  
     
  • That written, we don’t come to condemn small cap stocks, but to praise them. Outside of the strong gains the Russell 2000 has produced of late – up 13% over the prior three months even with last week’s stumble – one could argue, and we would be in that camp, that the index hitting an all-time high (see chart, far right) is a bullish sign for the market, as more stocks are biased higher, helping push major US stock indices – including the S&P 500, the Nasdaq and the Russell, to new records.  
     
Picture 1

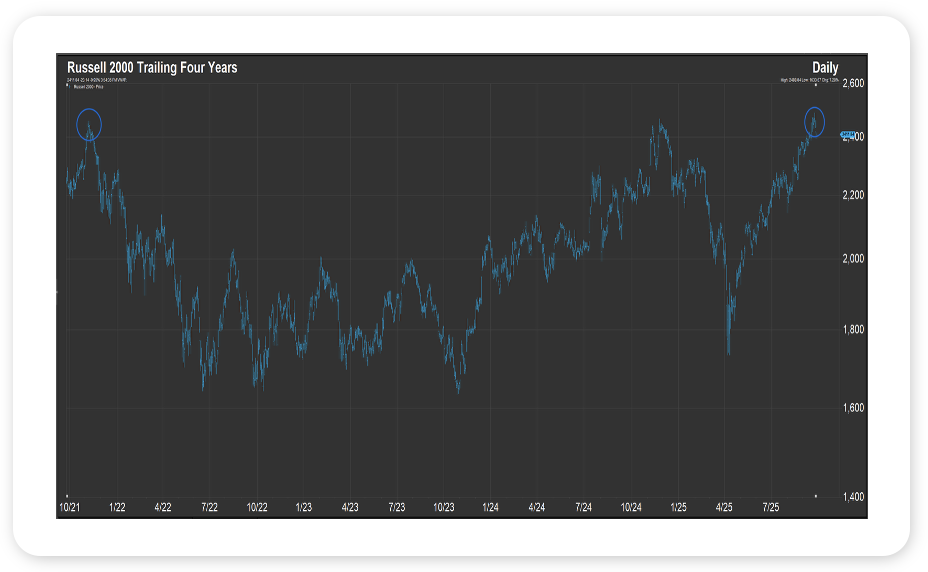
Source: FactSet, September 2025  


Looking Back, Looking Ahead

By Ben Vaske, BFA, Manager, Investment Strategy

Last Week

Markets took a modest step back, with the S&P 500 down 0.3%. That said, the index is still up about 2.5% for September, defying the month’s reputation as seasonally weak. International equities slipped on a stronger dollar but remain up roughly 25% year-to-date. Bonds fell as longer-term rates rose, while commodities gained more than 2% on the week and are now up 10% this year. All in all, balanced portfolios continue to show solid performance in September, the third quarter and year-to-date. 

On the economy, second-quarter GDP was revised 0.5% higher to 3.8%, a strong rebound from the -0.5% contraction in Q1. Core GDP, which excludes government spending, inventories, and trade, grew at a 2.9% annual rate, up from the prior 1.9% estimate. Other data also surprised to the upside. New home sales jumped 20.5% in August to an 800,000 annual pace, breaking above pre-pandemic levels, while durable goods orders came in much stronger than expected. Inflation, measured by the Fed’s preferred PCE index, rose 0.3% in August and is up 2.7% year-over-year, with the core measure running at 2.9%.  
 

This Week

Markets will be watching Washington closely, as the odds of a government shutdown are climbing, with betting markets assigning about a 70% chance that it begins on Wednesday morning. Later in the week, labor market data will be in focus after recent downward revisions. Consensus expectations are for just 45,000 jobs added in September, with the unemployment rate holding at 4.3%. 

The Fed’s next meeting is scheduled for October 29. As of September 26, market pricing shows an 88% chance of another 25-basis point cut. The Atlanta Fed’s GDPNow model projects Q3 growth at 3.9%, up from 3.3% the prior week, with the official release due in late October.

We hope you have a great week. If there’s anything we can do to help you, please feel free to reach out to ben.vaske@orion.com or opsresearch@orion.com.
 

Get Your Own Market Commentary

Client-Friendly Weekly Wire

Want a version of Weekly Wire you can send directly to your clients? Subscribe to our Weekly Wire newsletter and get a client-friendly version every Monday. Simply download, add your firm's logo, and use with your clients!


Key Data

Stocks, Bonds, Alternatives, and Real Assets as of September 26, 2025

Security Name

Risk Score

1 Wk

1 Mo

QTD

YTD

1 Yr

3 Yr Ann.

Global Equities (60% US, 40% Intl)

100

-0.55%

2.47%

6.71%

18.38%

16.76%

22.49%

S&P 500 Total Return

102

-0.30%

2.87%

7.39%

14.05%

17.16%

23.87%

Dow Jones Industrial Average

97

-0.15%

2.01%

5.33%

10.11%

11.54%

18.77%

NASDAQ 100 Total Return

122

-0.48%

4.23%

8.22%

17.26%

22.71%

30.68%

TV Benchmark

107

-0.31%

3.04%

6.98%

13.81%

17.14%

24.44%

Morningstar US Large Cap

102

-0.45%

3.51%

8.30%

15.52%

19.57%

26.06%

Morningstar US Mid Cap

113

-0.04%

0.89%

4.12%

9.54%

10.83%

16.99%

Morningstar US Small Cap

125

-0.80%

1.30%

7.81%

8.62%

9.58%

16.29%

Morningstar US Value

98

0.72%

1.83%

6.03%

12.21%

10.74%

17.37%

Morningstar US Growth

126

-0.97%

2.22%

5.95%

14.86%

21.94%

24.91%

MSCI ACWI Ex USA

98

-0.72%

2.14%

5.69%

25.05%

15.69%

20.75%

MSCI EAFE

101

-0.41%

0.88%

3.67%

24.32%

14.00%

22.02%

MSCI EM

98

-1.12%

4.23%

9.23%

26.24%

17.14%

17.65%

Bloomberg US Agg Bond Index

27

-0.28%

0.98%

1.81%

5.90%

2.69%

4.95%

Bloomberg High Yield Corp Bond Index

41

-0.23%

0.87%

2.42%

7.10%

7.48%

10.87%

Bloomberg Commodity Index

70

2.15%

4.20%

4.07%

9.83%

9.85%

3.18%

Wilshire Liquid Alternative Index

25

0.01%

1.34%

2.78%

5.58%

3.62%

5.84%

US Dollar

10

1.24%

0.12%

1.73%

-9.16%

-2.34%

-4.51%

Bloomberg US Treasury Bill 1-3mo

1

0.07%

0.39%

1.08%

3.23%

4.50%

4.87%

Source: Morningstar

The TV Benchmark represents an average of the S&P 500, Dow Jones IA, and NASDAQ 100 return indexes. The Orion Risk Score represents risk relative to the global equity market.


Interest Rates as of September 26, 2025

Rate

This Week

1 Wk Δ%

13-Wk Treasury Yield

3.86%

-0.02%

10-Yr Treasury Yield

4.19%

0.05%

Bloomberg US Agg Yield

4.42%

0.06%

Avg Money Mkt Yield

3.95%

-0.10%

Avg 30-Yr Mortgage Rate

6.27%

-0.12%

Sources: Yahoo Finance, S&P Global, Crane Data, BankRate


Key Economic Data Last Week

Data Point

Expectation

Actual

S&P Flash U.S. Services PMI

54.0

53.9

S&P Flash U.S. Manufacturing PMI

51.5

52.7

New Home Sales

649,000

800,000

Q2 GDP (third estimate)

3.3%

3.8%

Durable Goods Orders

-0.4%

2.9%

Personal Consumption Expenditures (PCE) YoY

2.7%

2.7%

Core PCE YoY

2.9%

2.9%

Consumer Sentiment

55.4

55.1

Source: MarketWatch


Key Economic Data This Week

Data Point

Expectation

Release Date

Job Openings

7.1M

9/30/25

Consumer Confidence

95.8

9/30/25

ADP Employment

40,000

10/1/25

ISM Manufacturing

48.9%

10/1/25

U.S. Employment Report

45,000

10/3/25

U.S. Unemployment Rate

4.3%

10/3/25

ISM Services

51.7%

10/3/25

Source: MarketWatch

 
More Just for You

Want Resources for Your Clients?

Get a version of Weekly Wire you can send directly to your clients. Subscribe to our Weekly Wire newsletter and get a client-friendly version every Monday. Simply download, add your firm's logo, and use with your clients!

The views expressed herein are exclusively those of Orion Portfolio Solutions, LLC d/b/a Brinker Capital Investments, a registered Investment Advisor, and are not meant as investment advice and are subject to change. Information contained herein is derived from sources we believe to be reliable, however, we do not represent that this information is complete or accurate and it should not be relied upon as such. This information is prepared for general information only. It does not have regard to the specific investment objectives, financial situation, and the particular needs of any specific person.

An index is an unmanaged group of assets considered to be representative of a select segment or segments of the market in general, as determined by the index manager for the purposes of managing a specific index. You cannot invest directly in an index.

The CFA® is a globally respected, graduate-level investment credential established in 1962 and awarded by CFA Institute — the largest global association of investment professionals. To learn more about the CFA charter, visit www.cfainstitute.org.

Think2perform’s Behavioral Financial Advice program integrates traditional finance practices with psychology and neuroscience to improve emotional competency and decision-making behavior that increases effective usage of the financial plan with clients. To obtain the Behavioral Financial Advisor (BFA) designation, participants must complete a self-directed course, which takes 20-30 hours to complete, and includes a mix of interactive exercises, videos and case studies. To learn more about the BFA, visit https://www.think2perform.com.

Wealth management services provided by Orion Portfolio Solutions, LLC (“OPS”), a registered investment advisor. Orion OCIO services provided by TownSquare Capital, LLC (“TSC”), a registered investment advisors. OPS and TSC are affiliates and wholly owned subsidiaries of Orion Advisor Solutions, Inc.