


Weekly Notes from Tim
By Tim Holland, CFA, Chief Investment Officer
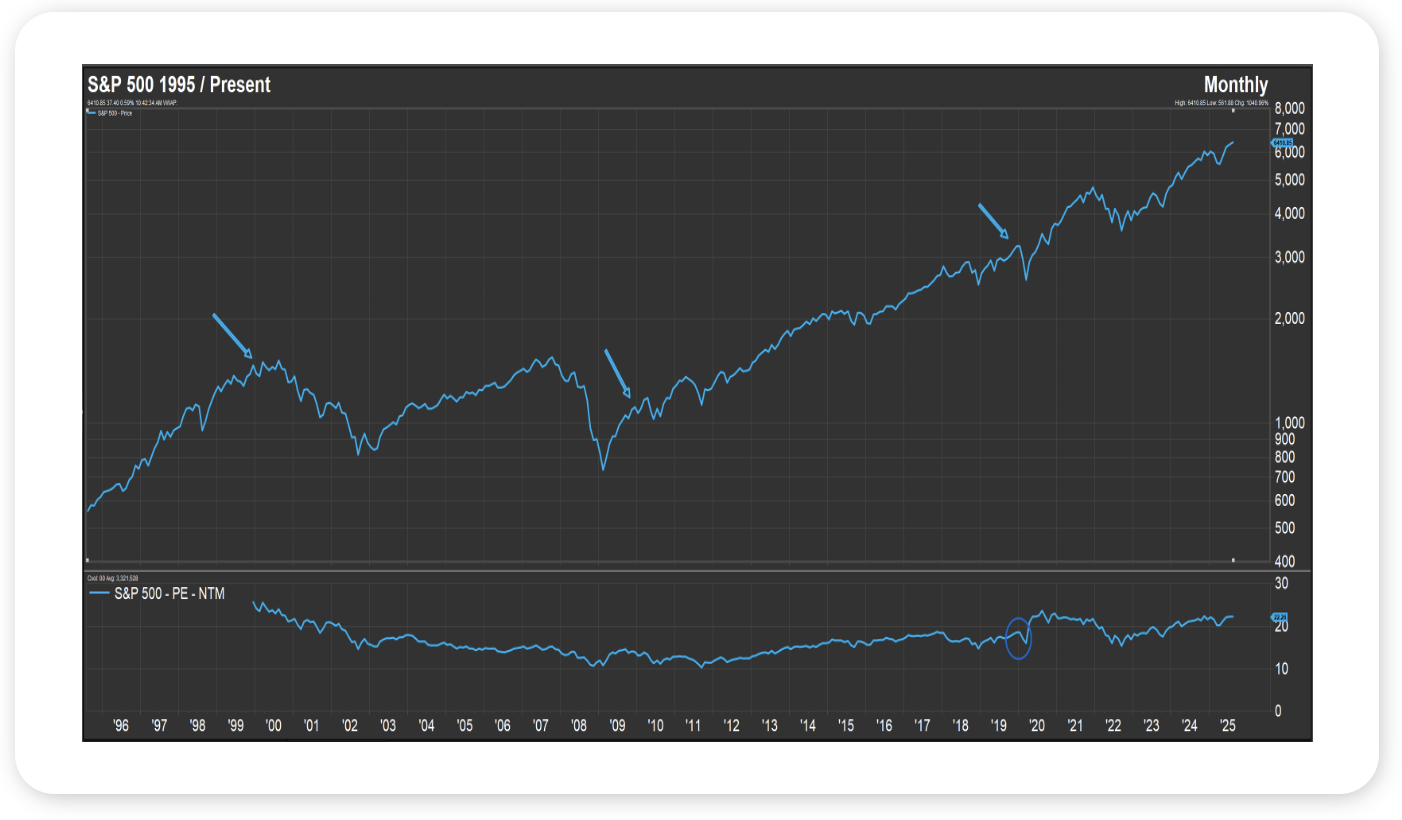
- As 2020 got going, some on Wall Street believed US equity investors should prepare for a lost decade; i.e., get ready for stocks to do a whole lot of nothing – or fall meaningfully – through 2030, an anticipated rerunning of the 2000s, when the S&P 500 began the decade at 1,469 and closed the decade at 1,115, for a loss of 24%, weighed down by dot.com era excesses, 9/11, an early 2000s recession, and the financial crisis late in the decade (see chart, top half – two arrows on the left).
- Two reasons for pessimism on US equities 5+ years ago were valuation, as the S&P 500 entered the 2020s trading at 19x its expected next twelve-month earnings, a 17-year high multiple (see chart, bottom half – circle), and stocks had done so well the prior decade, with the S&P 500 gaining 190% from 2010 through 2019 (see chart, top half – arrow on the right). And US stocks did get off to a rough start in 2020, as the Covid-19 induced bear market saw the S&P 500 fall about 32% in just four weeks.
- Acknowledging we still have more than four years before we hit 2030, we would point out that US stocks have done far from nothing in the 2020s, with the S&P 500 gaining 100% through mid-August 2025. Market tailwinds this decade include expansionary fiscal and monetary policy responses to the pandemic; the emergence of the “Magnificent 7;” the Fed bringing down inflation without tipping the economy into recession; rising corporate profitability, and most recently, enthusiasm around AI and its potential impact on US productivity and growth. Beyond those catalysts, it is worth remembering that markets tend to go up much more than they go down, as the economy tends to expand much more than it contracts. Fingers crossed we will have an equally bullish story to tell come 2030.
Source: Factset, August 2025
Looking Back, Looking Ahead
By Ben Vaske, BFA, Manager, Investment Strategy
Last Week
Markets advanced modestly last week, as equities brushed off tariff headlines and mixed inflation data. Global equities gained more than 1 percent, led by US small caps and developed international stocks. Value outperformed growth in the US, while among the “TV benchmarks,” the NASDAQ lagged both the S&P 500 and Dow. Fixed income was flat on the week, though core bonds remain ahead of longer-term averages year-to-date.
On trade policy, the US and China extended their tariff deadline another 90 days, while NVIDIA and AMD agreed to remit 15 percent of Chinese sales revenue to the US government. This suggests tariff policy is evolving beyond country-specific measures to include company-specific enforcement, with Intel and Apple also reportedly engaged in discussions with regulators.
Inflation data was mixed. The Consumer Price Index rose 0.2 percent in July, up 2.7 percent year over year, with core CPI up 0.3 percent and 3.1 percent respectively. Importantly, the six-month trend shows a moderating pace, with headline inflation running at 1.9 percent annualized and core at 2.4 percent. The Producer Price Index, however, came in much hotter, rising 0.9 percent in July against expectations of 0.2 percent. Producer prices are now up 3.3 percent year over year, with core PPI up 3.7 percent.
Markets adjusted quickly to the data. Odds of a September rate cut briefly touched 99 percent during the week but fell back to about 85 percent after the hotter CPI and PPI reports. The Fed’s next meeting is September 17.
This Week
The economic calendar is lighter, with no major releases scheduled. Leading economic indicators are once again expected to decline, consistent with recent trends. Markets will watch for follow-through on inflation dynamics after last week’s CPI and PPI, as well as updates from key consumer names including Walmart, Target, and Home Depot. These reports may provide an important read on household resilience heading into the fall.
We hope you have a great week. If there’s anything we can do to help you, please feel free to reach out to ben.vaske@orion.com or opsresearch@orion.com.