


Our investment team is closely monitoring the developments in the Middle East and the impact they are having on commodity prices, the stock market, and the world economy. We lament the loss of innocent life, pray for the safety of U.S. troops in harm’s way and mourn the U.S. military servicemembers who have lost their lives.
You will continue to hear from us on the conflict with Iran. In the meantime, if you have any questions on the markets and the economy or if there is anything we can do to support you and your clients during this difficult time, please reach out to us via our Investment Strategy Team’s email address at opsresearch@orion.com.
Weekly Notes from Tim
By Tim Holland, CFA, Chief Investment Officer
- As we take pen to paper, it has been a tough month to date for US equities, with the S&P 500 off 2.5%. As to what sparked the pullback, there are a few catalysts we could call out, including an escalation of hostilities in the Middle East (though stocks rallied late last week on news of a potential US / Iran deal), renewed concerns about the AI cap ex cycle, profit taking after a robust May for markets, and portfolio managers selling existing positions to raise funds to purchase shares of SpaceX, which came public Friday. One other potential reason for the sell off that has faded from view a bit as investors have focused on the Middle East and SpaceX was the surprisingly strong May jobs report that hit June 5th and showed the US added a much better than expected 172K jobs last month and revised April and March job gains higher by 93K jobs (more on why good news for Main Street could be bad news for Wall Street in a second).
- One can question the “quality” of the recent jobs report – much of May’s hiring came in health care, social assistance and local government, sectors of the economy not associated with cyclical growth such as manufacturing and construction – but 172K new jobs is 172K new jobs, and one could consider those gains particularly impressive considering concerns AI is upending the labor market and that many economists believe the US only need add 50,000 jobs a month to keep the labor market stabile (given our changing demographics and changes to US immigration policy).
That all said, good news for Main Street – a robust jobs market – isn’t necessarily good news for Wall Street, as the hotter than expected May jobs report helped spike the yield on the US 10 Year Note by 10 basis points and had Wall Street talking about Fed Rate hikes instead of Fed rate cuts – and if there is one thing almost universally unwelcomed on Wall Street it’s a higher cost of capital. In a perfect world, the US jobs market remains on the front foot while labor force productivity continues to increase, as productivity gains could allow for higher wages and mitigate any upward pressure on inflation. Fingers crossed.
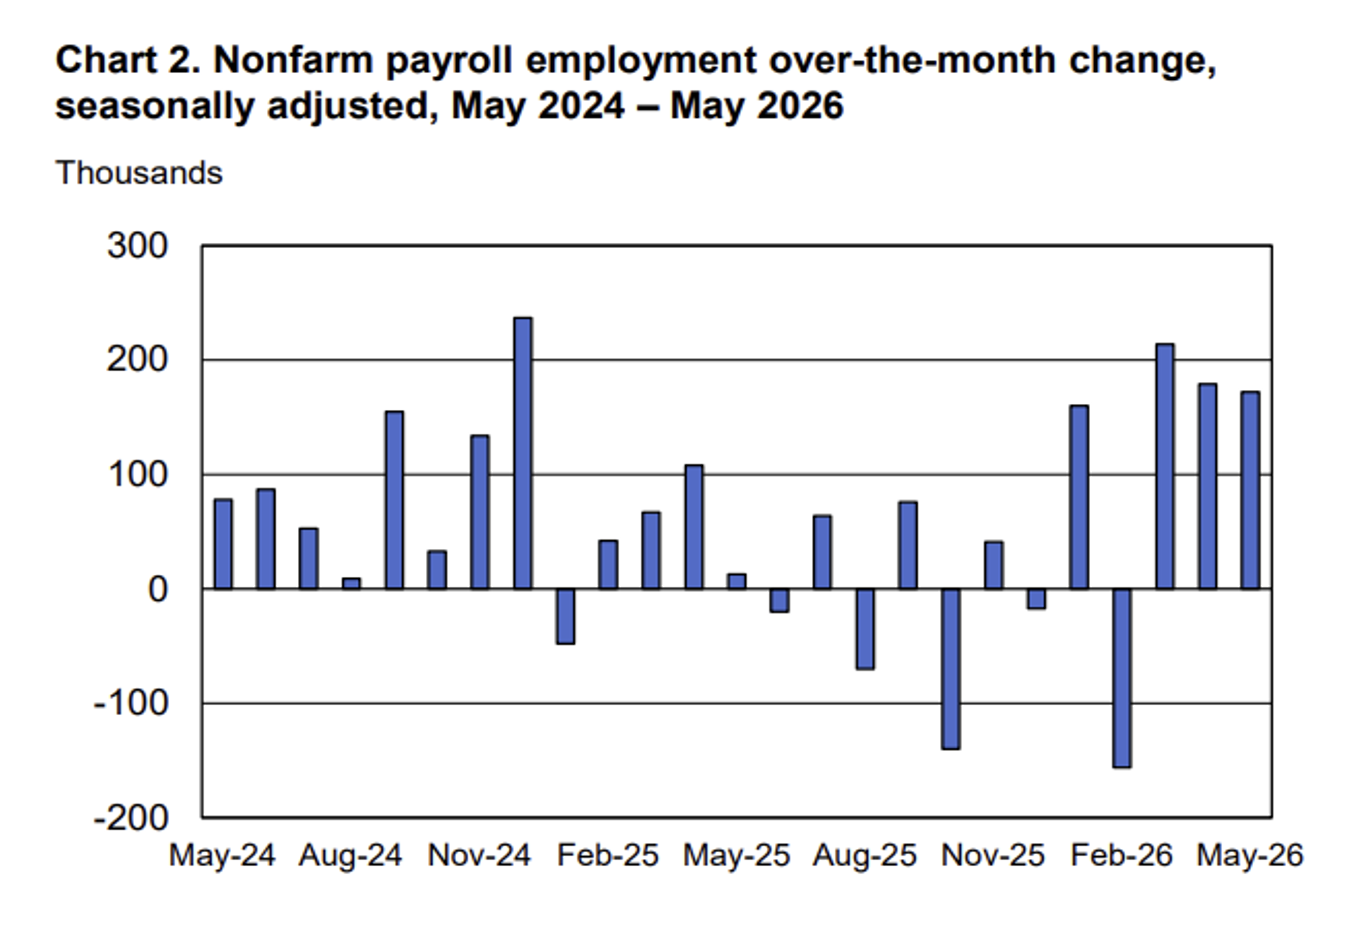
Source Bureau of Labor Statistics, June 2026
Looking Back, Looking Ahead
By Ben Vaske, CFA, Manager, Investment Strategy
Last Week
The week's marquee event arrived Friday with the SpaceX IPO, which by most measures delivered. Shares closed approximately 20% above their opening price of $135, pushing the company past $2 trillion in market cap and into the top 10 of global companies by size. Also on Friday, the U.S. Commerce Department restricted foreign nationals from accessing Anthropic's newly released Fable 5 model on national security grounds, prompting Anthropic to disable the model entirely.
Global equities posted modest gains on the week, with small caps leading at roughly 3%, followed by the NASDAQ 100 and U.S. growth stocks. REITs continued their quiet climb and now sit at nearly 18% year-to-date, one of the stronger performing asset classes of 2026. The 10-year Treasury yield dipped just below 4.5%, giving the Bloomberg Agg enough of a lift to move back into positive territory for the year.
On the inflation front, CPI came in as expected at 4.2% year-over-year, while PPI rose 6.5%, above consensus, as energy prices continued to reflect the ongoing Iran conflict. A separate report from Redfin showed the median U.S. home sale price hitting a record high near $401,000, giving the Fed little additional cover to consider rate cuts in the near term.
This Week
All eyes are on Wednesday, when Kevin Warsh presides over his first FOMC meeting as Fed Chair. With markets pricing a 99% probability of no change in rates, the substance of Warsh's press conference and the updated dot plot projections will carry more weight than the rate decision itself.
Investors will be listening closely for any signals on the forward rate path, the Fed's evolving inflation framework, and how the committee is thinking about the timeline for eventual easing. Retail sales data is also due this week, where any sign of consumer resilience will be closely watched given that consumption drives roughly 70% of U.S. GDP. Markets are closed Friday in observance of Juneteenth.
We hope you have a great week. If there’s anything we can do to help you, please feel free to reach out to ben.vaske@orion.com or opsresearch@orion.com.