Our investment team is closely monitoring the developments in the Middle East and the impact they are having on commodity prices, the stock market, and the world economy. We lament the loss of innocent life, pray for the safety of U.S. troops in harm’s way and mourn the U.S. military servicemembers who have lost their lives. 

You will continue to hear from us on the conflict with Iran. In the meantime, if you have any questions on the markets and the economy or if there is anything we can do to support you and your clients during this difficult time, please reach out to us via our Investment Strategy Team’s email address at opsresearch@orion.com

Weekly Notes from Tim

By Tim Holland, CFA, Chief Investment Officer

  • The war with Iran has raged for a month. At the risk of stating the obvious, its most meaningful economic impact has been on the price of oil, with a barrel of West Texas Intermediate going for $99 today vs $67 on February 27th. I bring up the price of oil as I believe most economists are most worried about the inflationary impact of the conflict, as opposed to the growth impact of the conflict…..it isn’t that economists would welcome a slowdown in growth, just that they – I think – would feel the global economy could more easily rebound from a war driven slowdown in growth than policy makers could mitigate a war driven spike in inflation. And the fact inflation was running ahead of the Federal Reserve’s long-term target before the war began amplifies those concerns (the Fed’s preferred inflation gauge, the Personal Consumption Expenditures Price Index, rose 2.8% year on year in January vs the central bank’s long-term target of 2%).
     
  • While not minimizing the impact higher oil prices are having on the American consumer – a gallon of gas goes for $3.98 today vs $2.98 a month ago – we think the Fed will, for now, look past the inflation implications of the oil price spike. Where it would get more complicated for the Fed is if oil prices stayed high or moved higher still – again, stating the obvious – or if the oil price spike drove long-term inflation expectations higher (most economists and central bankers believe high inflation expectations beget high inflation). Either development would complicate the Fed’s ongoing fight against inflation.
     
  • We don’t know where oil prices are headed, but we do know long-term inflation expectations remain anchored, with the St. Louis Fed’s 5-Year, 5-Year Forward Inflation Expectation Rate – essentially what investors think inflation will average over the five years beginning five years from now – holding at 2.11% up barely from a month ago, and well off its 2025 high of 2.4% (see chart).
     
  • For now, inflation expectations remain modest, and that is a great thing for the economy and markets.
Picture 1

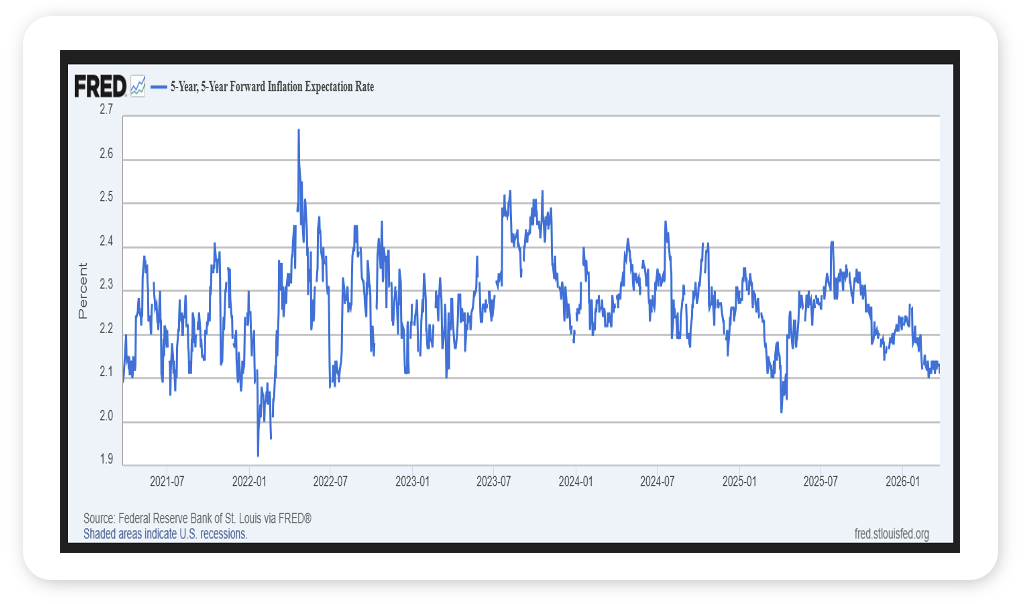
Source, Federal Reserve Bank of St. Louis, March 2026


Looking Back, Looking Ahead

By Ben Vaske, BFA, Manager, Investment Strategy

Last Week

Global equities declined just over 1% on the week, led by weakness in U.S. growth and technology stocks. The S&P 500 is now down nearly 7% year to date and the NASDAQ 100 is down over 8%, while value stocks have remained more resilient and are still positive on the year. International equities have given up most of their early 2026 gains amid a stronger U.S. dollar and ongoing geopolitical stress. Commodities continue to lead all major asset classes in 2026, with the Bloomberg Commodity Index up over 20% year to date as oil and metals prices have moved higher. 

Markets remained under pressure as the Strait of Hormuz has remained largely closed and tensions in the Middle East have continued to escalate. Oil prices stayed elevated and volatile, closing the week around $101 per barrel, reinforcing inflation concerns. 

Rates continued to move higher, with the 10Y Treasury yield approaching the top end of its recent range of 4.00% - 4.50%, closing at 4.44%. 

This Week

It is a shortened trading week with markets closed on Friday for Good Friday, but geopolitics and oil price volatility will likely continue to dominate headlines. 

U.S. employment data and retail sales will be released this week. After last month’s weaker-than-expected jobs report, investors will be looking for confirmation that the labor market remains resilient, especially as rising oil prices push inflation expectations higher and complicate the Federal Reserve’s policy outlook. 

We hope you have a great week. If there’s anything we can do to help you, please feel free to reach out to ben.vaske@orion.com or opsresearch@orion.com.
 

Get Your Own Market Commentary

Client-Friendly Weekly Wire

Want a version of Weekly Wire you can send directly to your clients? Subscribe to our Weekly Wire newsletter and get a client-friendly version every Monday. Simply download, add your firm's logo, and use with your clients!


Key Data

Stocks, Bonds, Alternatives, and Real Assets as of March 27, 2026

Security Name

Risk Score

1 Wk

1 Mo

QTD

YTD

1 Yr

3 Yr Ann.

Global Equities (60% US, 40% Intl)

100

-1.37%

-8.44%

-3.83%

-3.83%

17.71%

17.75%

S&P 500 Total Return

102

-2.10%

-7.31%

-6.68%

-6.68%

13.28%

18.63%

Dow Jones Industrial Average

97

-0.90%

-7.61%

-5.65%

-5.65%

8.61%

13.77%

NASDAQ 100 Total Return

122

-3.19%

-7.25%

-8.23%

-8.23%

17.65%

23.16%

TV Benchmark

107

-2.07%

-7.39%

-6.85%

-6.85%

13.18%

18.52%

Morningstar US Large Cap

102

-2.70%

-7.34%

-8.62%

-8.62%

13.41%

20.00%

Morningstar US Mid Cap

113

-0.25%

-7.11%

-0.57%

-0.57%

11.13%

13.75%

Morningstar US Small Cap

125

0.08%

-7.99%

-2.08%

-2.08%

14.84%

13.19%

Morningstar US Value

98

0.57%

-5.55%

1.36%

1.36%

13.83%

15.92%

Morningstar US Growth

126

-3.32%

-8.83%

-8.95%

-8.95%

10.87%

17.13%

MSCI ACWI Ex USA

98

-0.83%

-9.42%

0.73%

0.73%

23.96%

16.96%

MSCI EAFE

101

0.09%

-10.37%

-1.31%

-1.31%

18.54%

15.37%

MSCI EM

98

-1.83%

-10.36%

3.51%

3.51%

31.48%

17.55%

Bloomberg US Agg Bond Index

27

-0.12%

-2.49%

-0.79%

-0.79%

4.39%

3.55%

Bloomberg High Yield Corp Bond Index

41

-0.47%

-1.97%

-1.29%

-1.29%

5.81%

8.90%

Bloomberg Commodity Index

70

0.12%

10.57%

23.37%

23.37%

32.32%

14.22%

Wilshire Liquid Alternatives 

25

-0.48%

-2.06%

-0.25%

-0.25%

6.24%

5.87%

MSCI US REIT

104

-0.48%

-7.42%

2.97%

2.97%

5.91%

10.53%

US Dollar

10

0.67%

2.16%

1.60%

1.60%

-4.44%

-1.05%

Bloomberg US Treasury Bill 1-3mo

1

0.07%

0.28%

0.86%

0.86%

4.15%

4.83%

Source: Morningstar

The TV Benchmark represents an average of the S&P 500, Dow Jones IA, and NASDAQ 100 return indexes. The Orion Risk Score represents risk relative to the global equity market.


Interest Rates as of March 27, 2026

Rate

This Week

1 Wk Δ%

13-Wk Treasury Yield

3.61%

-0.01%

10-Yr Treasury Yield

4.44%

0.05%

Bloomberg US Agg Yield

4.67%

0.02%

Avg Money Mkt Yield

3.47%

0.00%

Avg 30-Yr Mortgage Rate

6.33%

0.09%

Sources: Yahoo Finance, S&P Global, Crane Data, BankRate


Key Economic Data Last Week

Data Point

Expectation

Actual

US Productivity (Revision)

1.8%

1.8%

Import Price Index

0.7%

1.3%

Initial Jobless Claims

210,000

210,000

Consumer Sentiment (Final)

54.0

53.3

Source: MarketWatch


Key Economic Data This Week

Data Point

Expectation

Release Date

Job Openings

7.0M

3/31/26

U.S. Retail Sales

0.4%

4/1/26

ADP Jobs

--

4/1/26

ISM Manufacturing

52.0

4/1/26

U.S. Trade Deficit

-$61.7B

4/2/26

U.S. Employment Report

45,000.0

4/3/26

U.S. Unemployment Rate

0.0

4/3/26

Source: MarketWatch

 
More Just for You

Want Resources for Your Clients?

Get a version of Weekly Wire you can send directly to your clients. Subscribe to our Weekly Wire newsletter and get a client-friendly version every Monday. Simply download, add your firm's logo, and use with your clients!

The views expressed herein are exclusively those of Orion Portfolio Solutions, LLC d/b/a Brinker Capital Investments, a registered Investment Advisor, and are not meant as investment advice and are subject to change. Information contained herein is derived from sources we believe to be reliable, however, we do not represent that this information is complete or accurate and it should not be relied upon as such. This information is prepared for general information only. It does not have regard to the specific investment objectives, financial situation, and the particular needs of any specific person.

An index is an unmanaged group of assets considered to be representative of a select segment or segments of the market in general, as determined by the index manager for the purposes of managing a specific index. You cannot invest directly in an index.

The CFA® is a globally respected, graduate-level investment credential established in 1962 and awarded by CFA Institute — the largest global association of investment professionals. To learn more about the CFA charter, visit www.cfainstitute.org.

Think2perform’s Behavioral Financial Advice program integrates traditional finance practices with psychology and neuroscience to improve emotional competency and decision-making behavior that increases effective usage of the financial plan with clients. To obtain the Behavioral Financial Advisor (BFA) designation, participants must complete a self-directed course, which takes 20-30 hours to complete, and includes a mix of interactive exercises, videos and case studies. To learn more about the BFA, visit https://www.think2perform.com.

Wealth management services provided by Orion Portfolio Solutions, LLC (“OPS”), a registered investment advisor. Orion OCIO services provided by TownSquare Capital, LLC (“TSC”), a registered investment advisors. OPS and TSC are affiliates and wholly owned subsidiaries of Orion Advisor Solutions, Inc.