


Our investment team is closely monitoring the developments in the Middle East and the impact they are having on commodity prices, the stock market, and the world economy. We lament the loss of innocent life, pray for the safety of U.S. troops in harm’s way and mourn the U.S. military servicemembers who have lost their lives.
You will continue to hear from us on the conflict with Iran. In the meantime, if you have any questions on the markets and the economy or if there is anything we can do to support you and your clients during this difficult time, please reach out to us via our Investment Strategy Team’s email address at opsresearch@orion.com.
Weekly Notes from Tim
By Tim Holland, CFA, Chief Investment Officer
- In last week’s note, we made the case that the stock market has been looking past a still unsettled geo-political picture, elevated oil prices and inflation expectations, and depressed consumer sentiment, and looking toward better days to come for the economy, earnings, inflation and interest rates. Of course, time will tell if this rally has legs and if Wall Street’s April optimism will prove to be founded or unfounded. In this week’s note we want to take another look at the rally, but in a bit more granular fashion, specifically its jumping off point and the two factors that we believe set the stage for the recent and dramatic rerating of risk assets, and for us that is valuation and sentiment (we acknowledge that deescalation in the Middle East and the price of oil dropping from $113 to $96 a barrel, as measured by WTI, have been powerful tailwinds for markets, that those factors have helped push stocks higher, but we don’t think they set the stage for the rally).
- As we know, the S&P 500 traded down to 6,317 on March 30th, just shy of a 10% correction from its then all-time high of 7,002, which it had hit on January 28th. As we would expect, as US equities sold off valuation improved, with the price to earnings ratio on the S&P 500 falling to 19x the index’s expected earnings over the next twelve months. Interestingly, the S&P 500 bottomed out two other times over the past three years not very far removed from that multiple, hitting 18x next twelve months earnings in April 2025 and October 2023 (see chart). As one would also expect, as stocks fell so did investor optimism, with the AAII Sentiment Survey showing 51.4% of respondents as bearish on stocks the week ending April 1st compared to an historic average bearish reading of 31%.
We believe valuation and sentiment came together late last month to put a floor under the market and set the stage for its recent rally, and as it concerns that rally, the S&P 500 has gained nearly 13% since March 30th, closing at 7,108 on April 23rd. That written, while valuation and sentiment can set the stage for a rally, we think fundamentals – particularly earnings and interest rates – are what ultimately drive stock prices over the long-term. Q1 earnings season and the Fed’s April meeting loom large.
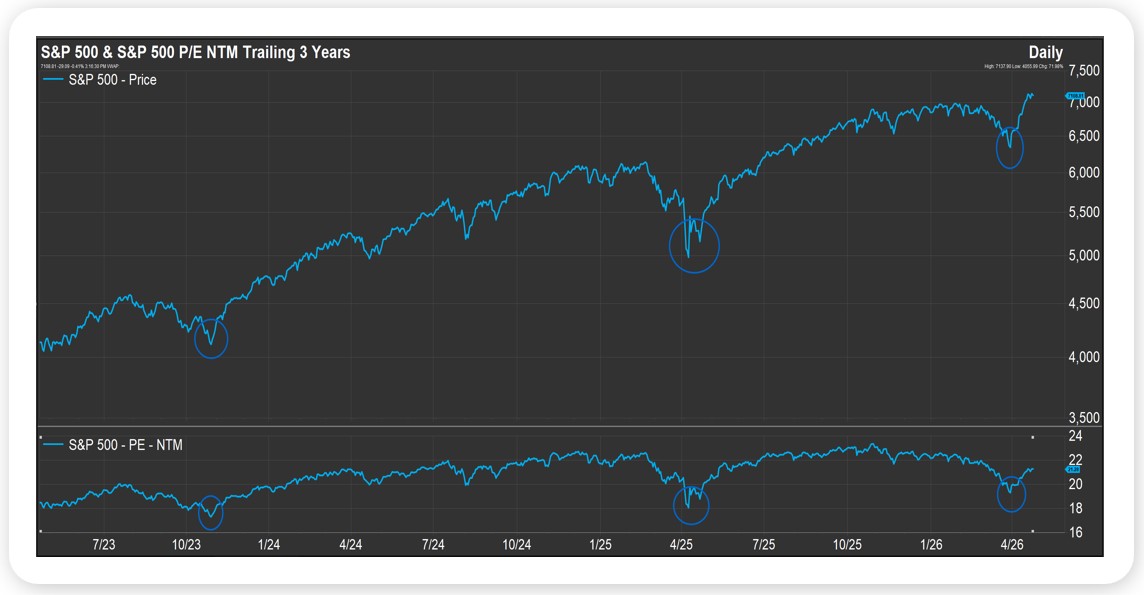
Source, FactSet April 2026
Looking Back, Looking Ahead
By Ben Vaske, BFA, Manager, Investment Strategy
Last Week
Markets continued their upward momentum last week, with U.S. large caps leading gains as geopolitical conditions remained relatively stable and supported a risk-on environment. The S&P 500 and NASDAQ 100 both posted another positive week, contributing to whatwas recently the strongest four-week stretch for the S&P 500 since 1950.
Economic data reinforced the theme of resilience, with retail sales coming in well above expectations. However, the strength in the headline number was somewhat misleading, as much of the increase was driven by higher gas prices rather than broad-based consumer demand. At the same time, policy developments added a new layer of uncertainty, as the Department of Justice dropped its investigation into Federal Reserve Chair Jerome Powell, paving the way for new leadership at the central bank.
Performance across asset classes was mixed but generally constructive. U.S. equities moved higher overall, while the Dow lagged slightly. The U.S. dollar strengthened meaningfully, creating a headwind for developed international equities, though they still lead U.S. markets year to date. Emerging markets remain the top-performing equity segment. Commodities were strong again, driven by a roughly 10% increase in oil prices, pushing the broader commodity index further ahead as the leading asset class in 2026. Interest rates moved modestly higher, with the 10-year Treasury yield ticking up on the week.
This Week
This week brings a heavy slate of both economic data and earnings that will help shape the next phase of market direction. Key economic releases include first quarter GDP, the Fed’s preferred inflation gauge (PCE), and manufacturing PMI data, all of which will provide important insight into the strength of the economy and the trajectory of inflation.
The Federal Reserve will also announce its latest interest rate decision, with markets fully expecting no change in policy. As a result, investor focus will likely shift toward any updates in forward guidance, especially given evolving leadership dynamics at the Fed.
Earnings season remains front and center, with several major technology companies reporting, including Microsoft, Amazon, Meta, Alphabet, and Apple. These releases will be critical in validating the strength of corporate fundamentals and determining whether the recent market rally can continue.
We hope you have a great week. If there’s anything we can do to help you, please feel free to reach out to ben.vaske@orion.com or opsresearch@orion.com.