





















Our investment team is closely monitoring the developments in the Middle East and the impact they are having on commodity prices, the stock market, and the world economy. We lament the loss of innocent life, pray for the safety of U.S. troops in harm’s way and mourn the U.S. military servicemembers who have lost their lives.
You will continue to hear from us on the conflict with Iran. In the meantime, if you have any questions on the markets and the economy or if there is anything we can do to support you and your clients during this difficult time, please reach out to us via our Investment Strategy Team’s email address at opsresearch@orion.com.
Weekly Notes from Tim
By Tim Holland, CFA, Chief Investment Officer
- While the media and most investors are typically most concerned with the stock market, all eyes have been on the bond market of late, which isn’t surprising given government bond yields around the globe have hit multi-year highs; the anticipation of the September Fed meeting and the first expected rate hike since 2023 (which we got) and growing fears inflation will accelerate due to higher oil prices and cost pressures brought about by the AI build out.
- On top of all that it has been a tough 2026 for fixed income investors with the iShares AGG ETF off 1.5% year-to-date, which is a reminder it has been a tough few years for fixed income investors, with the AGG producing an average annual return of -0.3% since July 2020 (given the S&P 500 is up 11.3% year to date and up 17% on an annual basis since July 2020 it would make sense investors would want to pay more attention to the stock market than the bond market). But, if you think about where fixed income investors would start out today, where they end up a few years down the road should be much better than where they have been of late.
- In July of 2020, the Fed Funds Rate and the yield on the US 10-Year Note stood at 0.13% and 0.62% (see chart), and since rising rates are kryptonite to bond prices and bond prices fall as yields rise, it was reasonable to assume then that the next few years could prove challenging to traditional fixed income (i.e., it was hard to see rates and yields moving lower). Then, as governments around the world re-opened their economies as the pandemic waned, and pent-up demand met still challenged supply chains and distribution networks, inflation shot higher, followed by interest rates as central banks tried to put the inflation genie back in the bottle. While equity prices, broadly speaking, did well as the US and other nations saw their economies go from strength to strength, fixed income investors had a very different experience (though strong economic growth has kept bond defaults low and coupon payments steady).
- Now, with bond yields at multi-decade highs, the outlook for fixed income is much more constructive than it was in mid 2020 – consider the difference between loaning the US government money for 10 years and getting paid 0.62% in interest per year (July 2020) or 5% in interest per year (September 2026). One other point worth making is our research has shown around a 90% correlation between the return one earns on a bond and the yield on the bond at point of purchase. Said differently, odds are good a buyer of a US 10 Year Note today will earn about 5% per year on a go forward basis. After a tough stretch, bonds might just be back.
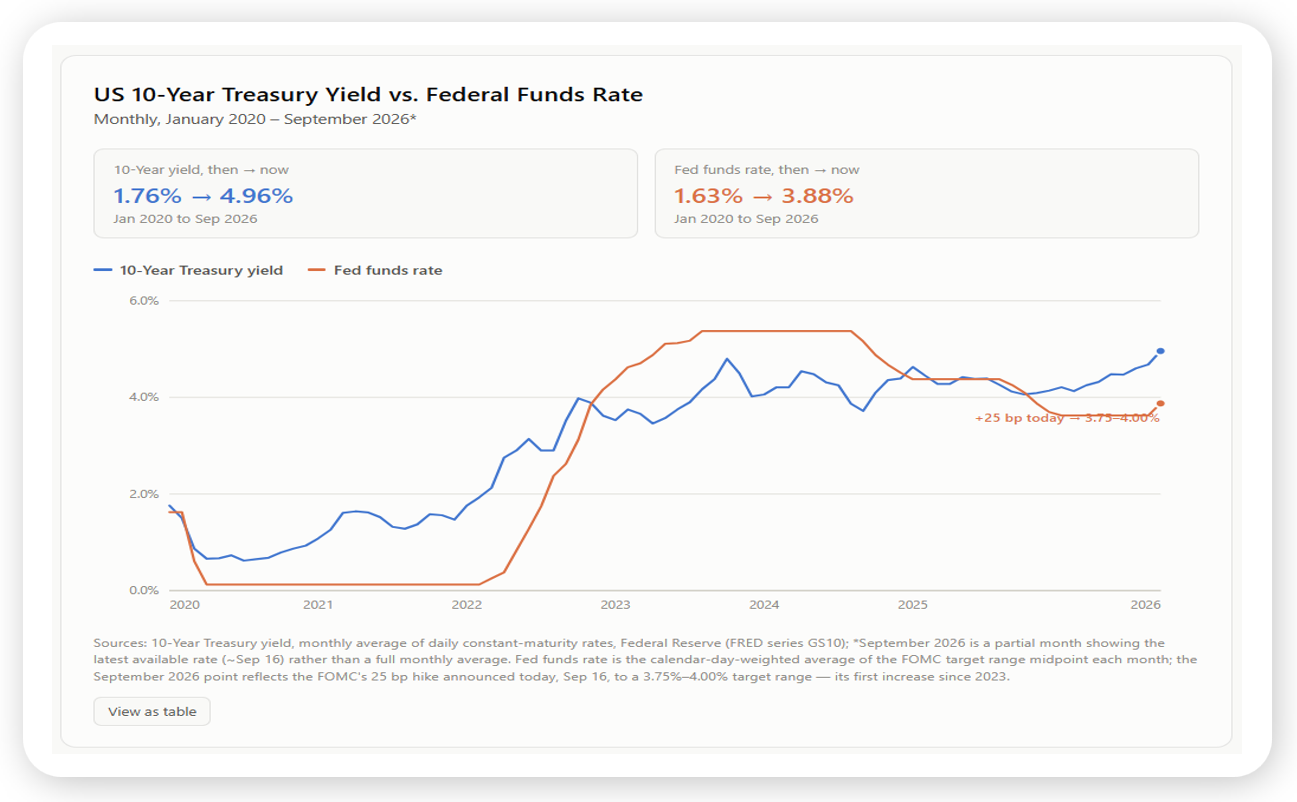
Source: Federal Reserve Bank of St. Louis; Federal Reserve Open Mark Committee, September 2026
Looking Back, Looking Ahead
By Ben Vaske, CFA, Manager, Investment Strategy
Last Week
The Fed delivered its first rate hike since 2023 on Wednesday, raising the Federal Funds Rate by 25 basis points as widely expected. Warsh's commentary was relatively straightforward, characterizing the move as a justified removal of accommodation in an environment where inflation remains too high. Markets reacted with a clear large cap growth versus everything else dynamic: the NASDAQ 100 gained just under 1% and large caps were modestly positive, while the Dow fell nearly 2%, small caps dropped nearly 1.5%, and value slipped nearly 1.5%, consistent with a market repricing around a hawkish Fed outcome. International markets were broadly negative, with developed markets falling nearly 1.5% and emerging markets off just over half a percent as the U.S. dollar surged more than 1% on the week following the hike. REITs fell roughly 2%. Notably, the hike did not immediately translate to the longer end of the curve, with the Bloomberg Agg finishing roughly flat and the 10-year Treasury yield closing the week at exactly 5.00%.
Retail sales were the week's economic bright spot, rising 1.2% in August against an expectation of 0.8%, the strongest monthly gain in five months. The U.S. consumer continues to demonstrate resilience that is at odds with the deeply negative sentiment readings that have persisted throughout the year. Beneath the surface, however, market breadth has deteriorated sharply, with roughly 50% of S&P 500 stocks now trading below their 200-day moving average, a stark reversal from the 72% reading just weeks ago and a signal that index-level strength near all-time highs is being driven by a narrow subset of names. The next FOMC meeting is October 28th, with markets currently pricing a 58% probability of another 25 basis point hike.
This Week
It is a lighter week for economic data, with flash PMIs, durable goods orders, and University of Michigan consumer sentiment as the primary releases. Over the weekend, President Trump announced an agreement with Denmark giving the U.S. full control over security in Greenland, a geopolitical development worth monitoring for any downstream market or policy implications.