


- Happy Tuesday. I hope you had a wonderful long weekend.
- Regretfully, the conflict in the Ukraine escalated over the long weekend. Thankfully, except for the move higher in oil prices, the early market reaction has been somewhat muted. What to think of Ukraine? Expect to see a lot more analysis in the days ahead, but let’s just use the words from one of the top technical analysts in the industry (Chris Verrone from Strategas) from his early morning comments today: “It’s always tempting to prognosticate how a headline event – geopolitical conflict, Fed action, etc. – may change the complexion of the market, but it’s been our experience that exogenous inputs do more to reinforce trends already in place rather than change the game.”
- Last week, the overall US stock market ended down nearly -2%. The losses were led by growth stocks, down nearly -3%. Value stocks lost about 1%. Not much was positive, except commodities which were up about 2%. Regarding growth stocks, more extensive damage continues to happen in the more aggressive growth names that benefitted from the pandemic. For example, last Friday Roku (ROKU) stock plunged 23% (and now down 70% from its highs) and DraftKings (DKNG) fell 22% after their 4Q21 earning announcements.
- For the month, the overall US stock market is down about 3%. There are some markets higher for the month, including small cap value in the US and non-US stocks, led by emerging market equities. Commodities are higher for the month.
- For the year, the overall US stock market is down about 9% year-to-date. Among the few positives, emerging market equities have slight gains. Commodities are up nearly 13% year-to-date. It should be noted that Gold is perking up - this morning it is at its highest levels since January 2021.
- Last week Ten Year Treasury Yields dropped 2 basis points to 1.93%. The intraday high yield last week was nearly 2.07%, the highest since July 2019.
- Besides geopolitical tensions, yields ultimately were likely influenced by economic data last week that was also on the mildly discouraging side. As the 2/18/22 BeSpoke Report notes,
- Housing Starts and Building Permits came in mixed both relative to expectations and December’s levels.
- Trends in housing starts have been a great leading indicator of the economic cycle over the years as the 12-month average of total Housing Starts tends to peak and roll over well in advance of a recession.
- The Conference Board’s Index of Leading Indicators also showed an unexpected decline of 0.3% versus forecasts for an increase of 0.2%. January’s decline ended a 10- month streak of gains and was the largest month-over-month decline since April 2020.
- Just as Housing Starts tend to be a good leading indicator for the economic cycle, the ratio of leading to coincident indicators has also had a good track record over the years of peaking in advance of recessions.
- The reason this is important is that for the first time since the early days of COVID, the ratio between the two declined in January.
- And remember, these recessionary signs are showing up before the Fed has even begun its rate hiking cycle.
- Lots of economic reports in this week's economic calendar. To be honest, I’m not sure if any of the reports will be major market movers given other news items, but we do have housing price data Tuesday and an update on 4Q GDP.
- Speaking of housing, it has been doing great, and now the average home purchase loan size hit a new all-time high of $453k. The average contract interest rate for 30-year fixed-rate mortgages with conforming loan balances ($647,200 or less) increased to 4.05% from 3.83%.
- Looking ahead to 1Q22 GDP, the current estimate according to GDPNow is 1.3%, down from 1.5% the week before.
- 4Q21 earnings season is winding down, and it’s been another good one, but according to BeSpoke Investments it has been a painful reporting period for stocks with the S&P 500 down nearly 7% for its worst earnings season performance since 2012.
- The AAII Investor Sentiment Survey is getting more interesting. As of last week, the percentage of bullish investors dropped to its lowest level since May 2016 (though there were more bears just a few weeks ago; it’s just that many investors moved to neutral from bearish). Note that this AAII data goes back to July 1987 and during those 35 years, there have only been 28 weeks with a lower %/bull (thus, this week’s score is in the lowest 2% of bullish investors). As the 2/18/22 BeSpoke Report again notes:
- [S]entiment is lower now than it was at the depths of the COVID crash and has fallen to its lowest level since early 2016 when Jamie Dimon ‘saved the market’ with an insider purchase of JP Morgan (JPM) shares.
- Besides that period, the only two other periods where net bullish sentiment was as low or lower was in the Summer of 2010 and during the Financial Crisis
- History doesn’t always repeat itself, but in the majority of prior periods when our composite reading of net bullish sentiment was in the bottom decile of historical readings like it is now, forward returns were better than average.
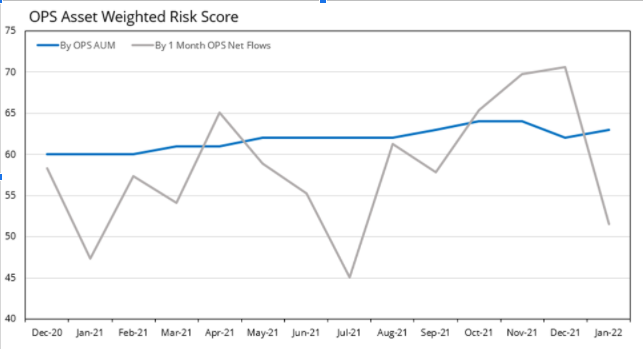
- For an additional frame of reference on investor sentiment, here is how the asset-weighted risk score on the Orion Portfolio Solutions platform has changed in recent months. Key points:
- The average dollar on OPS (blue line in chart below) started 2021 with a risk score of 60 and ended the year with an asset-weighted risk score of 63.
- Again, this means that the average invested dollar is taking 63% of the risk of the global equity market.
- This rise in risk is primarily due to the bull market in stocks, as advisor/investor net flows (gray line on chart below) was usually BELOW the average OPS risk.
- Note that advisor/investor net flows actually went ABOVE average risk at the end of the year, regretfully before the recent correction.
- January flows were just above 50, which is well below the current average and near the lowest levels of last year.
- The market is expensive by historical measures. Despite the warning from some, in the latest OPS Reference Guide we show that while valuations do make a difference (even over 1-year time frames) as higher valuations do typically mean lower returns 12 months later , history also shows that the market still generates positive returns over 70% of time when “expensive” and nearly a 50% historical probability of a double-digit positive return!
- Has anyone asked how to adjust portfolios if inflation persists and interest rates continue to rise? Besides this tip to Diversify, Diversify, Diversify!, I have to give yet another hat tip to Ben Carlson’s Wealth of Common Sense article on inflation – and how value stocks tend to outperform when inflation is higher.
- Then again, here’s a thought-provoking reason why value has underperformed in recent years, and may not perform as well as it has – ESG investing. This white paper explains that the “green factor” explains much of the recent underperformance of value stocks.
- Tactical strategies are those that can make large changes in asset and risk allocations. Perhaps they’ll get more sunshine given a recent Natixis survey of investment professionals found that:
- Eighty percent of the investment professionals responsible for fund selection and portfolio construction at leading wealth management firms, private banks and wirehouses across North America agree that investors have taken on too much portfolio risk in a rate environment that has distorted stock values and decimated bond yields.
- Most fund selectors expect more volatility in the stock market (78%) and bond market (71%).
- 68% say more frequent rebalancing will be important as markets churn.
- 84% are expanding their model portfolio offering, an approach they say streamlines the investing process (92%), gives clients across their firm a more consistent investment experience (86%), and can enhance investors’ potential to outperform the market benchmarks (55%).
- I italicized the comment about turnover above. Note that pages 25 and 26 of the OPS Reference Guide shows the annual value of rebalancing is 17-35 basis points (or about 1/3 of 1%) per year. If the markets are indeed more volatile, but with lower returns, it would make sense that more rebalancing turnover could add more value.
- Speaking of smart portfolio turnover, we mentioned this article before WSJ Article: Just How Valuable Is Tax-Loss Harvesting, and it’s worth repeating some of the nuggets in this regarding the value of tax loss harvesting. In my opinion, these qualify as wowza stats.
- Investors can enhance returns 1.99 percentage points a year on average, assuming a 35% tax rate if they are taking advantage of every tax-loss harvesting opportunity.
- Investors can enhance returns even more when the stock market is having a down year. During years when the S&P 500 yielded a negative return, the article estimated the average benefits of harvesting losses amount to 4.49 percentage points of additional return to one’s equity portfolio (assuming a 35% tax rate).
- In decades when the S&P 500 exhibited higher-than-average volatility, the average investor can realize 3.10 percentage points a year in additional returns via tax-loss harvesting (assuming a 35% tax rate).
- After starting the week strong, cryptocurrency prices fell into the weekend. Bitcoin is trading around $37,000 after being as high as $44,000 a week prior, falling 13% on the week. Ethereum dropped 12%, with Solana and Avalanche each dropping 14%.
- JP Morgan launched what they are claiming as the first bank in the Metaverse, in the virtual world Decentraland. Senior Federal Reserve officials are now banned from owning cryptocurrencies, stocks, or many other financial instruments. Mastercard announced a consulting service to help companies adopt and adapt to the use of digital assets.
- Domestic ETF news was light last week. Fidelity received approval to launch a physically backed Bitcoin ETP in Europe.
- More on crypto from industry stalwart Matt Hougan:
- Crypto is now a $2 trillion industry that has elbowed its way into the mainstream. Last weekend, there were six crypto-focused Super Bowl ads. And if that’s not enough, consider:
- 55 of the 100 largest financial institutions in the world are now investing in crypto and blockchain;
- Coinbase, the largest crypto brokerage, has twice as many accounts as Charles Schwab;
- BlackRock has filed to launch a crypto-focused equity ETF.
- This week on Orion's The Weighing Machine podcast is John Davi from Astoria Portfolio Advisors. Long considered one of the top experts on ETFs, John talks about his outlook, new strategies in the industry, and of course much more. Also, while he’s a tough New Yorker that I wouldn’t mess with, his walk-up song might surprise you.
- “Inflation is a very serious subject, you could argue it is the way democracies die…so [the current situation] is the biggest long-range danger we have, apart from nuclear war.” Charlie Munger This quote was from some of his comments from Daily Journal Annual Meeting last week.
- More Munger comments from last week: Munger comments at Daily Journal's Annual Meeting. If you’re a fan of Munger, you’ll like his quick quips. Remember, he’s 98. Some say he’s the magic behind Warren Buffett. Maybe, but I would definitely say he’s written one of the top 5 books on investing ever, and it’s easy and fun to read: Poor Charlie's Almanack.
- RIP PJ O'Rourke, arguably the best American economic humorist ever (though I realize some may think Will Rogers), passed away last week. I did read multiple O’Rourke books, and I learned something and laughed in every one of them.
- Thanks for reading and have a great week! For more resources, please check out the Financial Advisor Success Hub, and as always, please let us know what we can do better at rusty@orion.com or ben.vaske@orion.com.
- Have a great week!
The CFA is a globally respected, graduate-level investment credential established in 1962 and awarded by CFA Institute — the largest global association of investment professionals. To learn more about the CFA charter, visit www.cfainstitute.org.
The CMT Program demonstrates mastery of a core body of knowledge of investment risk in portfolio management. The Chartered Market Technician® (CMT) designation marks the highest education within the discipline and is the preeminent designation for practitioners of technical analysis worldwide. To learn more about the CMT, visit https://cmtassociation.org/.
"The CAIA® is the globally-recognized credential for professionals managing, analyzing, distributing, or regulating alternative investments. To learn more about the CAIA, visit https://caia.org/."
0353-OPS-2/23/2022