Weekly Notes from Tim

By Tim Holland, CFA, Chief Investment Officer

  • I have worked in investments for 26 years but have been paying close attention to the markets and the economy for 33 years (before I became a hedge fund analyst in 2000, I did public relations work for investment banks and investment firms for seven years). Over those 33 years, I have been fortunate to come across great books on investing and macroeconomics; the work of world-renowned economists, and datasets that explained the performance patterns of risk assets.
     
  • On the book end of things, The Black Swan; Manias, Panics, and Crashes, and Reminiscences Of A Stock Operator are three I can heartily recommend; as for economists, Milton Friedman made me think about the power of free markets and how inflation manifests, while datasets from Evercore ISI and Strategas, two leading Wall Street research firms, helped me put market volatility in perspective and understand what market and economic environments favored what asset classes. With that written, I do believe that anyone in the markets should avail themselves of a wide range of ideas and opinions as it concerns investing and economics and arrive at a set of principles and ideas that work for them and that will help guide them as they put their capital to work.
     
  • A few of the ideas I keep in mind as an investor include Harry Markowitz’s maxim that diversification is the only free lunch in investing; markets go up much more than they go down; interest rates and earnings drive stock prices over the long-term; never count out the US consumer and drawdowns are a part of investing. And if I could only keep one idea about investing in mind it would be the last one, which is the subject of this week’s note…that over the last 39 years the S&P 500 has averaged an intra-year drawdown of 14% but managed to close higher or flat for the year 30 out of 39 times and deliver a total return of 3,592% (see chart)!
     
  • As we sit here in early February, with major US indices up year to date, it is probably a good time to remind ourselves markets will likely pull back at some point in 2026, and that pullback could be significant. But that is okay, we know drawdowns happen, and we know to keep our gaze fixed firmly on our long-term goals.
Picture 1

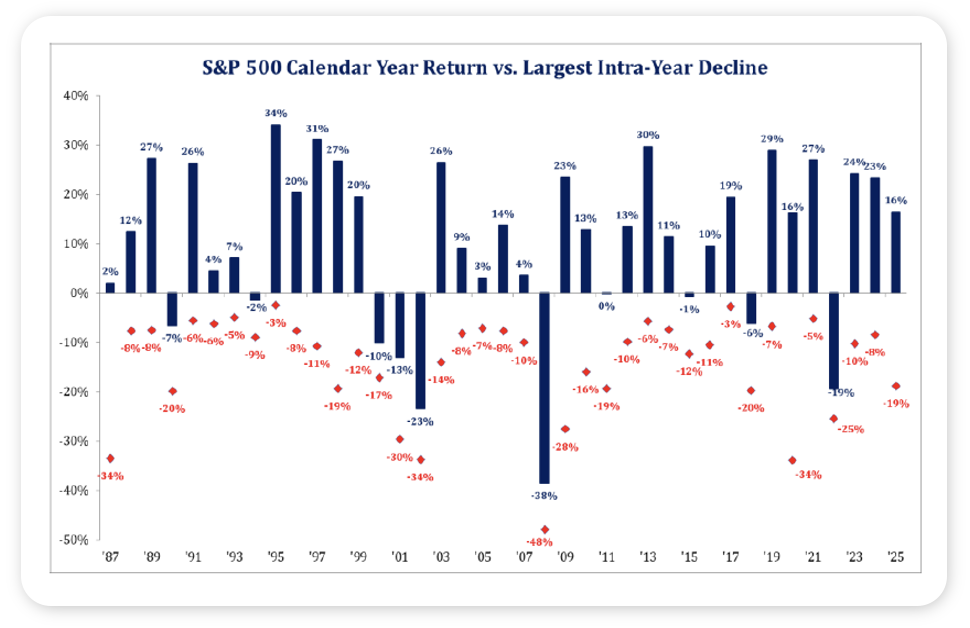
Source: Strategas, January 2026


Looking Back, Looking Ahead

By Ben Vaske, BFA, Manager, Investment Strategy

Last Week

Markets delivered mixed but resilient performance. Globally diversified equities posted modest gains despite weakness in U.S. growth stocks and small caps. Emerging markets continued to lead early in 2026 and are now up nearly 9% YTD, second only to commodities. All major equity indexes remain positive through January, a historically constructive seasonal signal.

The Federal Reserve left rates unchanged, as expected. Chair Powell’s comments were notably neutral and offered little insight into the forward path of policy, reinforcing the Fed’s data-dependent stance rather than signaling urgency in either direction.

Volatility emerged in perceived safe havens. Precious metals sold off while the US dollar rallied sharply on Friday, giving back a meaningful portion of their early-2026 gains in a single session. Silver’s roughly 30% decline marked its largest one-day drop on record, a reminder that even defensive assets are not immune to overexuberance.

Economic data was mixed. The trade deficit widened more than expected in November, contributing to a pullback in GDP expectations. December PPI surprised to the upside at 0.5%, though year-over-year producer inflation improved to 3.0%, down from 2024 levels.

This Week

Earnings take center stage. Another heavy slate of reports is ahead, led by Alphabet, Amazon, Palantir, Disney, and Eli Lilly. With policy largely sidelined for now, earnings results and guidance will play a larger role in shaping near-term market direction.

Labor data will also be in focus as the first week of the month brings several employment-related releases. While hiring has slowed in recent months, unemployment remains stable, and investors will be watching closely for any signs of a sharper deterioration.
PMI data early in the week will provide additional insight into business activity, while labor indicators later in the week will help confirm whether the recent cooling trend remains orderly.

As February begins, the broader narrative remains constructive. Market breadth is improving, diversification is working again, and earnings growth continues to support equity markets even as volatility flares intermittently.

We hope you have a great week. If there’s anything we can do to help you, please feel free to reach out to ben.vaske@orion.com or opsresearch@orion.com.
 

Get Your Own Market Commentary

Client-Friendly Weekly Wire

Want a version of Weekly Wire you can send directly to your clients? Subscribe to our Weekly Wire newsletter and get a client-friendly version every Monday. Simply download, add your firm's logo, and use with your clients!


Key Data

Stocks, Bonds, Alternatives, and Real Assets as of January 30, 2026

Security Name

Risk Score

1 Wk

1 Mo

QTD

YTD

1 Yr

3 Yr Ann.

Global Equities (60% US, 40% Intl)

100

0.57%

2.77%

3.31%

3.31%

23.06%

19.55%

S&P 500 Total Return

102

0.35%

1.45%

1.45%

1.45%

16.35%

21.11%

Dow Jones Industrial Average

97

-0.42%

1.80%

1.80%

1.80%

11.65%

14.94%

NASDAQ 100 Total Return

122

-0.19%

1.23%

1.23%

1.23%

19.82%

29.30%

TV Benchmark

107

-0.09%

1.49%

1.49%

1.49%

15.94%

21.79%

Morningstar US Large Cap

102

0.52%

0.84%

0.84%

0.84%

17.49%

23.67%

Morningstar US Mid Cap

113

-0.66%

3.05%

3.05%

3.05%

9.04%

11.94%

Morningstar US Small Cap

125

-2.05%

3.89%

3.89%

3.89%

12.13%

12.12%

Morningstar US Value

98

1.02%

3.92%

3.92%

3.92%

16.59%

14.17%

Morningstar US Growth

126

-1.81%

1.17%

1.17%

1.17%

11.02%

21.12%

MSCI ACWI Ex USA

98

1.35%

5.99%

5.99%

5.99%

35.60%

17.17%

MSCI EAFE

101

1.56%

5.22%

5.22%

5.22%

31.84%

16.77%

MSCI EM

98

1.80%

8.86%

8.86%

8.86%

43.67%

17.32%

Bloomberg US Agg Bond Index

27

0.03%

0.11%

0.11%

0.11%

6.85%

3.65%

Bloomberg High Yield Corp Bond Index

41

-0.16%

0.51%

0.51%

0.51%

7.70%

8.88%

Bloomberg Commodity Index

70

1.00%

10.36%

10.36%

10.36%

22.91%

7.61%

Wilshire Liquid Alternative Index

25

0.23%

1.02%

1.02%

1.02%

7.26%

5.73%

MSCI US REIT

104

0.78%

3.07%

3.07%

3.07%

5.02%

5.88%

US Dollar

10

-2.11%

-1.79%

-2.07%

-2.07%

-10.85%

-1.88%

Bloomberg US Treasury Bill 1-3mo

1

0.07%

0.30%

0.30%

0.30%

4.22%

4.90%

Source: Morningstar

The TV Benchmark represents an average of the S&P 500, Dow Jones IA, and NASDAQ 100 return indexes. The Orion Risk Score represents risk relative to the global equity market.


Interest Rates as of January 30, 2026

Rate

This Week

1 Wk Δ%

13-Wk Treasury Yield

3.57%

-0.01%

10-Yr Treasury Yield

4.24%

0.01%

Bloomberg US Agg Yield

4.36%

-0.02%

Avg Money Mkt Yield

3.50%

-0.01%

Avg 30-Yr Mortgage Rate

6.18%

0.04%

Sources: Yahoo Finance, S&P Global, Crane Data, BankRate


Key Economic Data Last Week

Data Point

Expectation

Actual

Durable Goods Orders - Nov

4.5%

5.3%

Consumer Confidence - Jan

90.0

84.5

U.S. Trade Deficit - Nov

-$42.9B

-$56.8B

U.S. Productivity - Q3

4.9%

4.9%

Producer Price Index (PPI) YoY - Dec

--

3.0%

Core PPI YoY - Dec

--

3.5%

Source: MarketWatch


Key Economic Data This Week

Data Point

Expectation

Release Date

ISM Manufacturing

48.4%

2/2/26

ISM Services

53.5%

2/3/26

Job Openings

7.1M

2/3/26

ADP Employment

45,000

2/4/26

U.S. Employment Report

55,000

2/6/26

U.S. Unemployment Rate

4.4%

2/6/26

Source: MarketWatch

 
More Just for You

Want Resources for Your Clients?

Get a version of Weekly Wire you can send directly to your clients. Subscribe to our Weekly Wire newsletter and get a client-friendly version every Monday. Simply download, add your firm's logo, and use with your clients!

The views expressed herein are exclusively those of Orion Portfolio Solutions, LLC d/b/a Brinker Capital Investments, a registered Investment Advisor, and are not meant as investment advice and are subject to change. Information contained herein is derived from sources we believe to be reliable, however, we do not represent that this information is complete or accurate and it should not be relied upon as such. This information is prepared for general information only. It does not have regard to the specific investment objectives, financial situation, and the particular needs of any specific person.

An index is an unmanaged group of assets considered to be representative of a select segment or segments of the market in general, as determined by the index manager for the purposes of managing a specific index. You cannot invest directly in an index.

The CFA® is a globally respected, graduate-level investment credential established in 1962 and awarded by CFA Institute — the largest global association of investment professionals. To learn more about the CFA charter, visit www.cfainstitute.org.

Think2perform’s Behavioral Financial Advice program integrates traditional finance practices with psychology and neuroscience to improve emotional competency and decision-making behavior that increases effective usage of the financial plan with clients. To obtain the Behavioral Financial Advisor (BFA) designation, participants must complete a self-directed course, which takes 20-30 hours to complete, and includes a mix of interactive exercises, videos and case studies. To learn more about the BFA, visit https://www.think2perform.com.

Wealth management services provided by Orion Portfolio Solutions, LLC (“OPS”), a registered investment advisor. Orion OCIO services provided by TownSquare Capital, LLC (“TSC”), a registered investment advisors. OPS and TSC are affiliates and wholly owned subsidiaries of Orion Advisor Solutions, Inc.