Our investment team is closely monitoring the developments in the Middle East with a particular focus on how events are impacting commodity prices, the stock market, and the world economy. We lament the loss of innocent life, pray for the safety of U.S. troops in harm’s way and mourn the U.S. military servicemembers who have lost their lives.

Our Asset Allocation Committee is meeting again this week. We will keep you apprised of any changes to our market and economic outlook and you will continue to hear from us often on the conflict with Iran. As it concerns this week’s note…

Weekly Notes from Tim

By Tim Holland, CFA, Chief Investment Officer

  • It feels unseemly obsessing over the markets and economy while war rages in the Middle East, thousands of our troops are in harm’s way and seven U.S. servicemembers have lost their lives. We hope peace comes to the Middle East and pray for the safety of our troops and those who made the ultimate sacrifice, as well as their loved ones. And it feels naïve to make an optimistic case for the markets and the economy considering the recent sharp drawdown in US stocks, a 35% spike in the price of oil in March and a February jobs report that showed the U.S. shed 92,000 jobs last month, but that is what we will do.
     
  • First, acknowledging some of this might feel like ancient history, Q4 S&P 500 earnings grew 14% year on year, the US economy added a healthy 126,000 jobs in January and Q4 GDP growth came in at 1.4% (below expectations but the government shutdown dinged growth). As to recent stock market weakness, at the risk of being hard hearted, we would note no major US equity index is off more than 8% from its 52-week high and all are up meaningfully on a trailing one-year basis. As it concerns energy prices, the increase in price of a barrel of West Texas Intermediate is historic, and will cause pain at the pump, but at the same time natural gas prices are well off their 2026 highs and trading near their one-year low (all data as of March 6th).
     
  • Moving forward, the Atlanta Fed’s GDPNowcast puts Q1 GDP growth at 2.1%, borrowing costs for high-yield issuers remains low (see chart), record U.S. oil production could help eventually put a lid on prices (see chart), productivity is surging and fewer bullish investors could signal a bottoming out for stock prices (see graph).
     
  • The world is a dangerous and unsettled place and could become more so…the conflict with Iran could spill well beyond its borders; the rise in oil prices could push broader inflation gauges higher and private markets, particularly private credit, could become a source of significant financial and economic risk. For now, however, we think there is little risk of the U.S. economy entering recession or U.S. equities entering a bear market. 
Picture 1

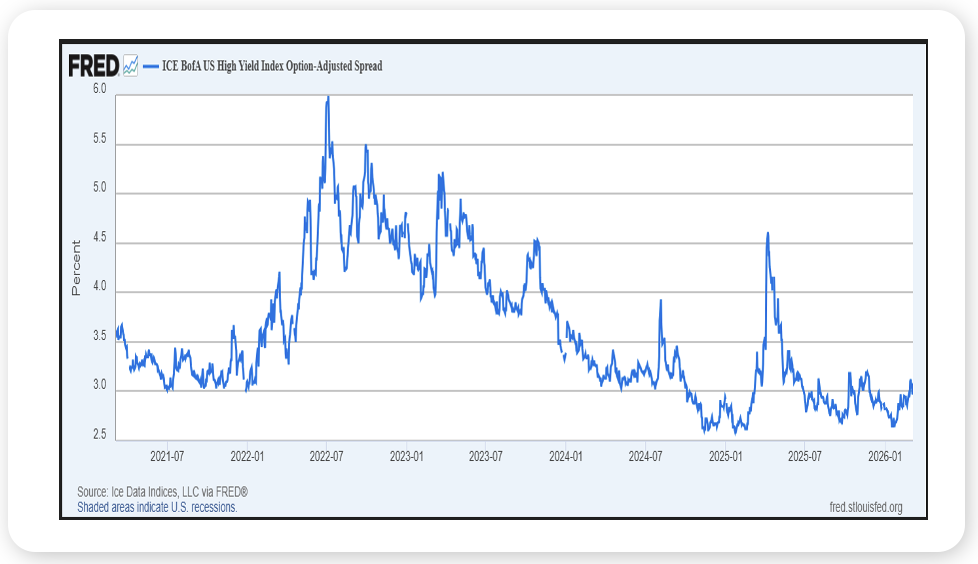
Source: St. Louis Federal Reserve Bank, March 2026

Picture 2

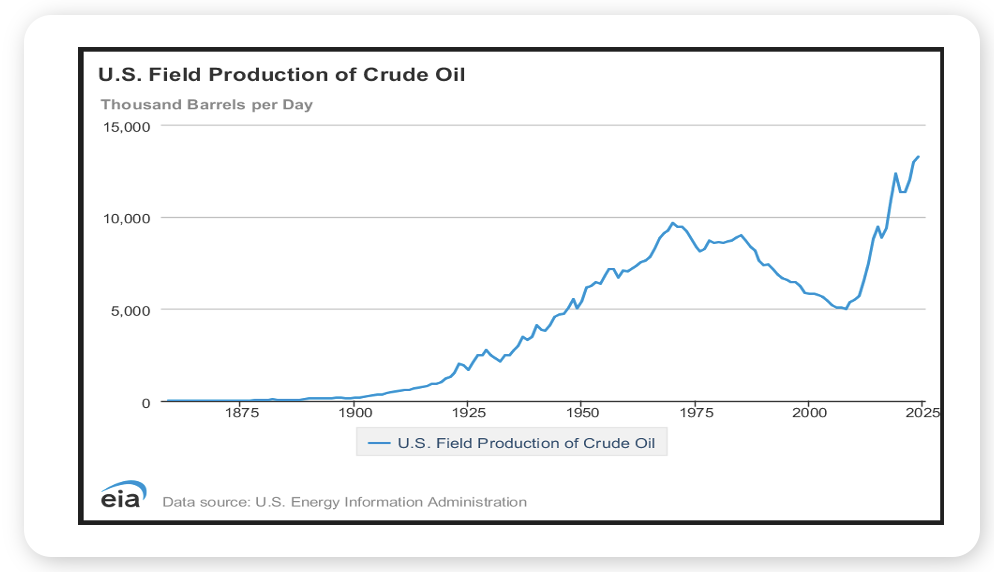
Source: U.S. EIA, March 2026

Picture 3

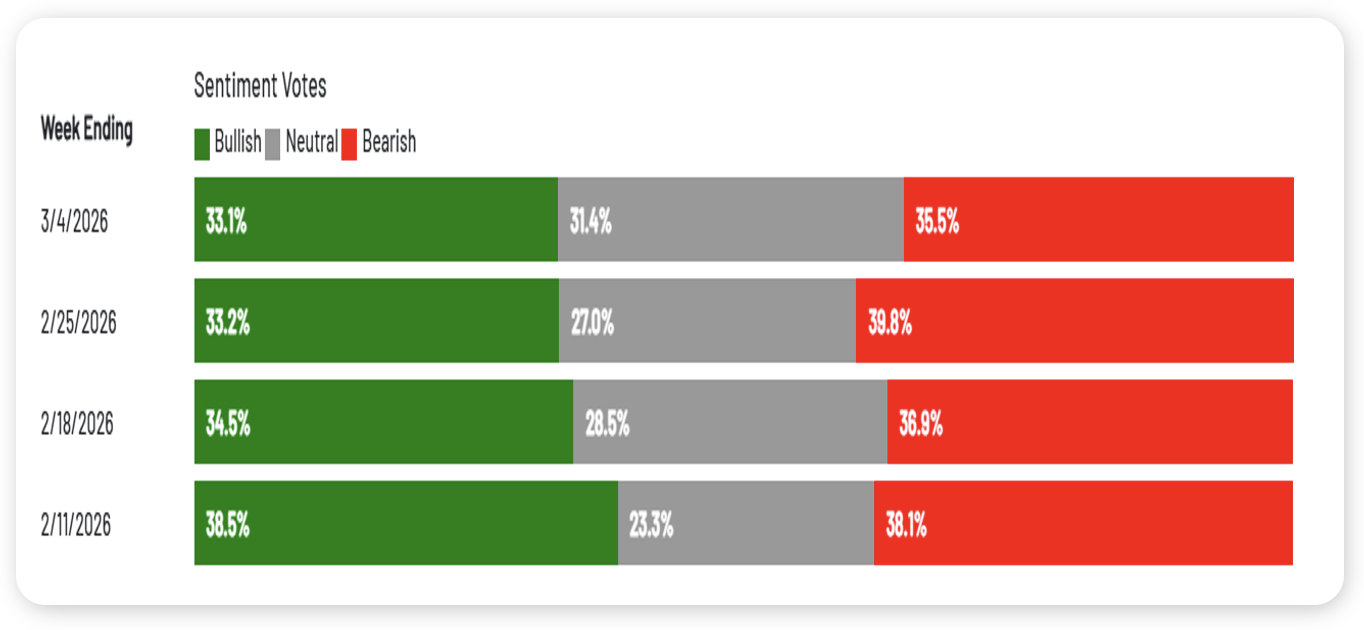
Source: AAII, March 2026


Looking Back, Looking Ahead

By Ben Vaske, BFA, Manager, Investment Strategy

Last Week

Geopolitical tensions escalated sharply as conflict involving Iran intensified, sending shockwaves through global markets. Developed and emerging international equities posted their worst weekly declines since February 2021, contributing to a nearly 4% drop in global equities. U.S. markets proved slightly more resilient, with the S&P 500 falling about 2% and the NASDAQ declining just over 1%.

Oil prices surged nearly 30% on the week as disruptions and reduced traffic near the Strait of Hormuz raised fears of supply shocks. The broader commodity index climbed more than 8%, while U.S. gasoline prices reached their highest levels since September 2024. The U.S. dollar also strengthened more than 1.5% as investors sought safety.

Economic data offered mixed signals. February nonfarm payrolls fell short of expectations by more than 140,000 jobs and the unemployment rate rose to 4.4%. At the same time, productivity growth disappointed despite recent optimism tied to AI-driven efficiency gains. Manufacturing and services data remained constructive, however, with both ISM indexes signaling continued expansion.

This Week

It’s a heavy week for economic data, which could significantly influence the market outlook and expectations for the Federal Reserve. Key releases include February Consumer Price Index (CPI), the first revision to Q4 GDP, and the Fed’s preferred inflation measure, Personal Consumption Expenditures (PCE).

Investors will also continue to monitor developments in the Middle East. Sustained disruptions in oil supply routes could keep energy prices elevated, potentially adding inflation pressure and weighing on corporate margins if higher input costs persist.

Policy expectations remain relatively stable for now. Markets are pricing a 96% probability that the Fed holds rates steady at its March 18 meeting.

Earnings season also continues with reports from Oracle and Adobe, which may offer additional insight into the health of enterprise technology and AI spending.

Despite the recent volatility, the broader message remains consistent. Markets have historically weathered periods of geopolitical tension, and disciplined investors who remain focused on long-term fundamentals have typically been rewarded once uncertainty subsides.

We hope you have a great week. If there’s anything we can do to help you, please feel free to reach out to ben.vaske@orion.com or opsresearch@orion.com.
 

Get Your Own Market Commentary

Client-Friendly Weekly Wire

Want a version of Weekly Wire you can send directly to your clients? Subscribe to our Weekly Wire newsletter and get a client-friendly version every Monday. Simply download, add your firm's logo, and use with your clients!


Key Data

Stocks, Bonds, Alternatives, and Real Assets as of March 6, 2026

Security Name

Risk Score

1 Wk

1 Mo

QTD

YTD

1 Yr

3 Yr Ann.

Global Equities (60% US, 40% Intl)

100

-3.85%

-2.29%

1.00%

1.00%

22.85%

18.68%

S&P 500 Total Return

102

-1.99%

-2.65%

-1.32%

-1.32%

18.96%

20.19%

Dow Jones Industrial Average

97

-2.92%

-4.99%

-0.86%

-0.86%

13.49%

14.55%

NASDAQ 100 Total Return

122

-1.24%

-1.64%

-2.28%

-2.28%

23.77%

27.03%

TV Benchmark

107

-2.05%

-3.09%

-1.49%

-1.49%

18.74%

20.59%

Morningstar US Large Cap

102

-1.48%

-2.80%

-2.83%

-2.83%

19.39%

22.23%

Morningstar US Mid Cap

113

-3.57%

-2.12%

3.21%

3.21%

15.59%

12.49%

Morningstar US Small Cap

125

-4.47%

-5.23%

1.66%

1.66%

19.32%

11.76%

Morningstar US Value

98

-2.85%

-3.02%

4.26%

4.26%

18.15%

14.97%

Morningstar US Growth

126

-2.32%

-2.63%

-2.45%

-2.45%

18.17%

19.23%

MSCI ACWI Ex USA

98

-6.47%

-1.70%

4.13%

4.13%

27.55%

17.06%

MSCI EAFE

101

-6.72%

-2.89%

2.70%

2.70%

21.80%

15.98%

MSCI EM

98

-6.88%

-0.35%

6.96%

6.96%

36.20%

18.06%

Bloomberg US Agg Bond Index

27

-0.96%

0.37%

0.77%

0.77%

5.73%

4.88%

Bloomberg High Yield Corp Bond Index

41

-0.43%

-0.36%

0.26%

0.26%

7.05%

9.03%

Bloomberg Commodity Index

70

8.13%

11.78%

20.65%

20.65%

31.07%

12.21%

MSCI US REIT

104

-2.26%

2.30%

8.71%

8.71%

9.56%

9.06%

US Dollar

10

1.56%

1.53%

1.01%

1.01%

-6.08%

-1.69%

Bloomberg US Treasury Bill 1-3mo

1

0.07%

0.28%

0.65%

0.65%

4.19%

4.87%

Source: Morningstar

The TV Benchmark represents an average of the S&P 500, Dow Jones IA, and NASDAQ 100 return indexes. The Orion Risk Score represents risk relative to the global equity market.


Interest Rates as of March 6, 2026

Rate

This Week

1 Wk Δ%

13-Wk Treasury Yield

3.57%

-0.01%

10-Yr Treasury Yield

4.13%

0.17%

Bloomberg US Agg Yield

4.35%

0.17%

Avg Money Mkt Yield

3.49%

0.00%

Avg 30-Yr Mortgage Rate

6.05%

-0.10%

Sources: Yahoo Finance, S&P Global, Crane Data, BankRate


Key Economic Data Last Week

Data Point

Expectation

Actual

ISM Manufacturing - Feb

52.0%

52.4%

ADP Employment - Feb

48,000

63,000

ISM Services - Feb

53.5%

56.1%

U.S. Productivity - Q4

1.8%

2.8%

U.S. Employment Report - Feb

50,000

-92,000

U.S. Unemployment Rate - Feb

4.3%

4.4%

Source: MarketWatch


Key Economic Data This Week

Data Point

Expectation

Release Date

Existing Home Sales - Feb

3.85M

3/10/26

Consumer Price Index (CPI) YoY - Feb

2.4%

3/11/26

Core CPI YoY - Feb

2.5%

3/11/26

U.S. Trade Deficit - Jan

-$65.3B

3/12/26

Housing Starts - Feb

1.33M

3/12/26

Fourth Quarter GDP (First Revision)

1.5%

3/13/26

Personal Consumption Expenditures (PCE) YoY - Jan

2.9%

3/13/26

Core PCE YoY - Jan

3.1%

3/13/26

Job Openings - Jan

6.8M

3/13/26

Source: MarketWatch

 
More Just for You

Want Resources for Your Clients?

Get a version of Weekly Wire you can send directly to your clients. Subscribe to our Weekly Wire newsletter and get a client-friendly version every Monday. Simply download, add your firm's logo, and use with your clients!

The views expressed herein are exclusively those of Orion Portfolio Solutions, LLC d/b/a Brinker Capital Investments, a registered Investment Advisor, and are not meant as investment advice and are subject to change. Information contained herein is derived from sources we believe to be reliable, however, we do not represent that this information is complete or accurate and it should not be relied upon as such. This information is prepared for general information only. It does not have regard to the specific investment objectives, financial situation, and the particular needs of any specific person.

An index is an unmanaged group of assets considered to be representative of a select segment or segments of the market in general, as determined by the index manager for the purposes of managing a specific index. You cannot invest directly in an index.

The CFA® is a globally respected, graduate-level investment credential established in 1962 and awarded by CFA Institute — the largest global association of investment professionals. To learn more about the CFA charter, visit www.cfainstitute.org.

Think2perform’s Behavioral Financial Advice program integrates traditional finance practices with psychology and neuroscience to improve emotional competency and decision-making behavior that increases effective usage of the financial plan with clients. To obtain the Behavioral Financial Advisor (BFA) designation, participants must complete a self-directed course, which takes 20-30 hours to complete, and includes a mix of interactive exercises, videos and case studies. To learn more about the BFA, visit https://www.think2perform.com.

Wealth management services provided by Orion Portfolio Solutions, LLC (“OPS”), a registered investment advisor. Orion OCIO services provided by TownSquare Capital, LLC (“TSC”), a registered investment advisors. OPS and TSC are affiliates and wholly owned subsidiaries of Orion Advisor Solutions, Inc.