Our investment team is closely monitoring the developments in the Middle East and the impact they are having on commodity prices, the stock market, and the world economy. We lament the loss of innocent life, pray for the safety of U.S. troops in harm’s way and mourn the U.S. military servicemembers who have lost their lives. 

You will continue to hear from us on the conflict with Iran. For now, we have not made any meaningful changes to our market and economic outlook or our asset allocation. As it concerns this week’s note…

Weekly Notes from Tim

By Tim Holland, CFA, Chief Investment Officer

  • I am trying, as you all are, to discern how the war with Iran will impact the economy and markets going forward. At the risk of stating the obvious, the duration of the conflict and its impact on commodity prices – specifically oil – should determine its impact on the global economy, corporate profits and equity prices. As I write this note on Friday, March 13th we are thirteen days into the war, and while Iran’s military capabilities are badly degraded there is no indication the regime is about to fall or surrender and the Strait of Hormuz, the waterway through which one fifth of the world’s daily supply of oil ships, remains essentially closed. I assume Iran’s ability to control the Strait diminishes over time and it will re open, possibly soon. Until then, markets should be volatile and the price of oil elevated. 
     
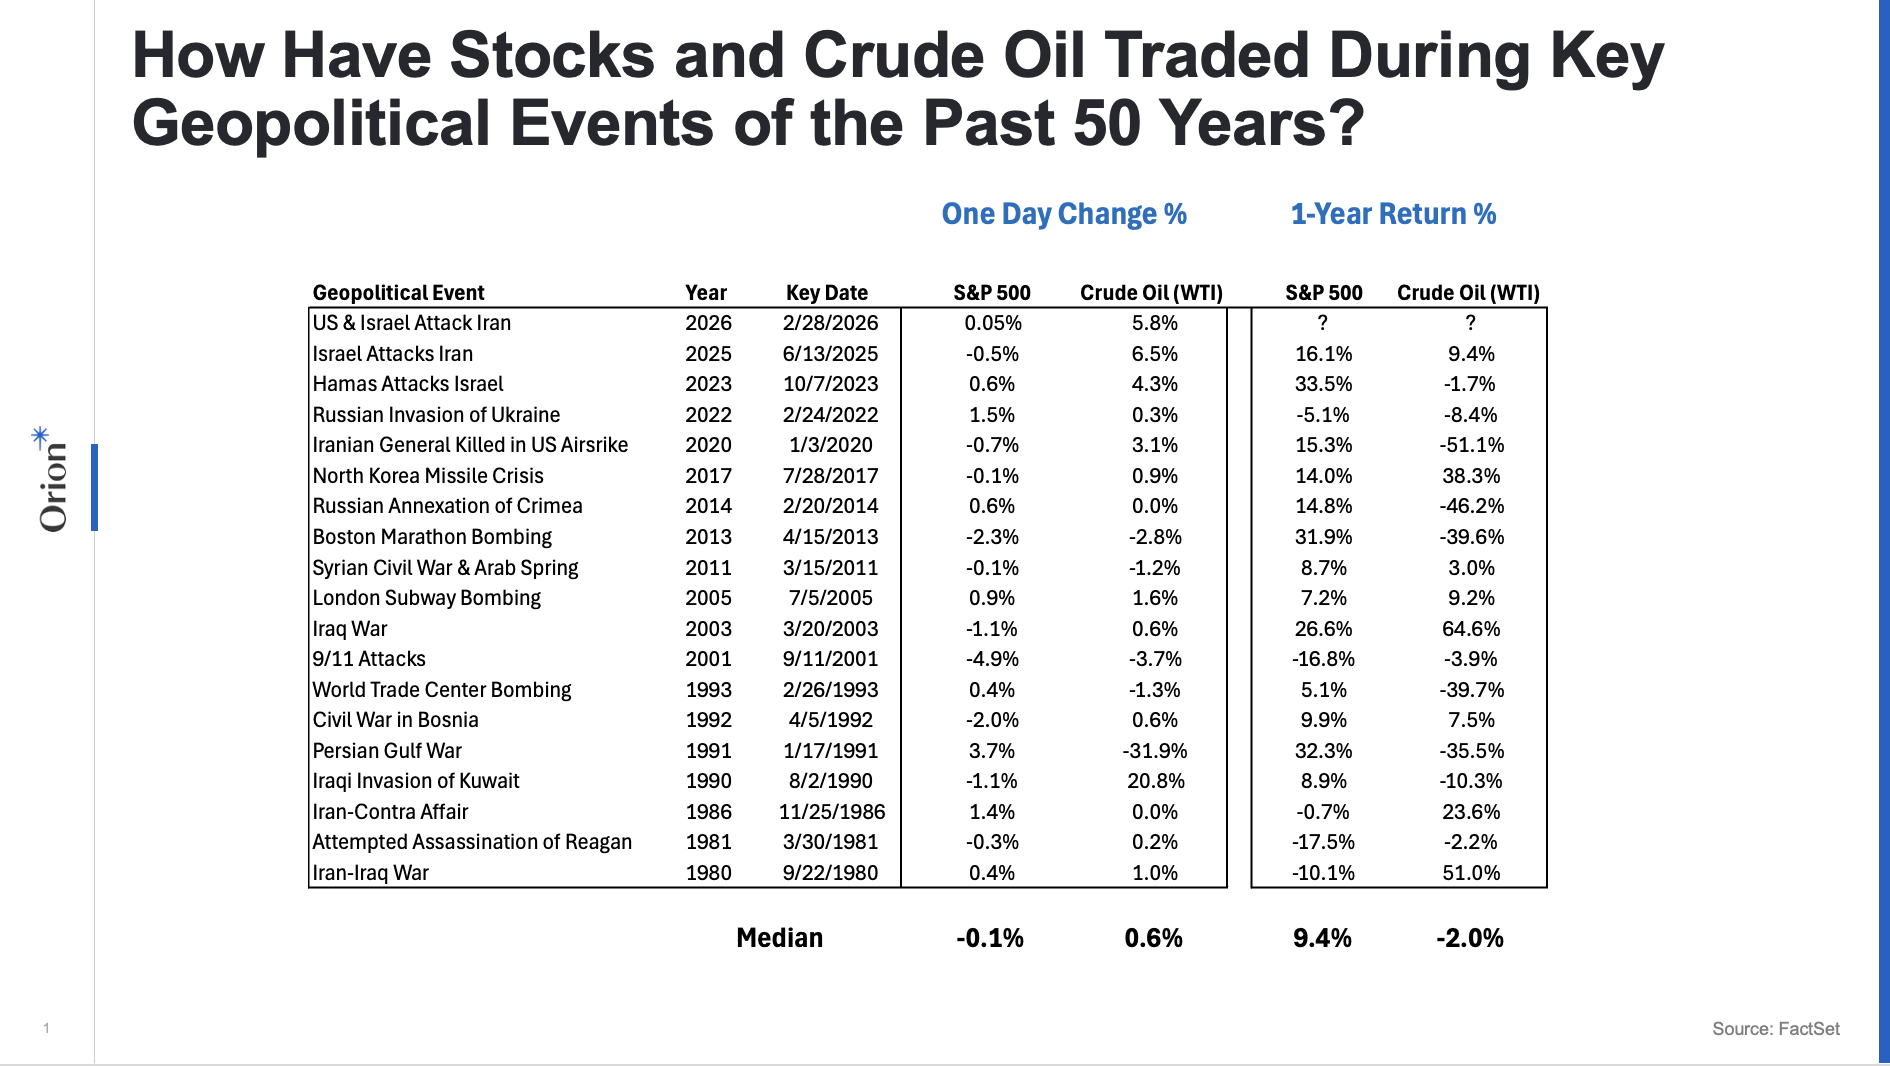
  • Since the path forward is unclear, I thought, as I often do during times of market distress, a look back might prove instructive. To that end, our team examined significant geo-political events of the past 45 years and how equities and oil traded the day of the event and twelve months out. Not surprisingly, equities – per the S&P 500 – tended to fall the day of while the price of oil – per West Texas Intermediate – tended to rise (the one big outlier being the Persian Gulf War when WTI fell 32%; it is worth noting oil had railed significantly in the months leading up to the launch of the US led campaign to expel Iraq from Kuwait). If we go out a year from the geo-political event, equites were higher and oil lower (see chart). And the average return for the S&P 500 would have been significantly greater were it not for the bear markets of the early 1980s and early 2000s which, one could argue, had less to do with geo-political risk and more to do with Fed Chairman Paul Volker raising interest rates to 22% to break the back of inflation and the bursting of the late 1990s stock market bubble.
     
  • There are very unsettling times, but if history is any guide, the stock market should be higher, and the price of oil should be lower, a year from now.


Picture 1


Looking Back, Looking Ahead

By Ben Vaske, BFA, Manager, Investment Strategy

Last Week

Oil volatility dominated markets as tensions in the Middle East persisted and the Strait of Hormuz remained closed. Crude prices swung dramatically throughout the week, opening near $100 per barrel, spiking to roughly $119, briefly falling below $80 midweek, and ultimately closing above $90. In response, the International Energy Agency announced plans to release 400 million barrels from strategic reserves, including 173 million barrels from the United States, in an effort to stabilize supply and prices.

Global equities struggled amid the uncertainty, declining about 2% on the week. Both U.S. and international markets moved lower as rising energy prices and geopolitical risks weighed on sentiment. Despite the recent pullback, emerging markets remain up roughly 5% YTD after a strong start to the year. 

Economic data painted a mixed picture. Inflation readings from both CPI and PCE came in largely as expected, but growth surprised to the downside. The first revision to Q4 GDP lowered growth from 1.4% to 0.7%, driven largely by a sharp decline in government spending. At the same time, Treasury yields moved higher for the second consecutive week, with the 10Y rising 17 bps as markets considered the inflation implications of higher oil prices.

This Week

The Federal Reserve takes center stage as policymakers announce their latest interest rate decision on Wednesday. Markets currently assign a 98% probability that the Fed will leave rates unchanged. Investors will focus closely on the accompanying policy statement and press conference for clues about how the Fed views rising oil prices and persistent inflation risks.

Geopolitics will remain a key variable. Markets continue to monitor developments in the Middle East and efforts to reopen the Strait of Hormuz. Sustained disruptions to global oil supply could keep energy prices elevated and increase pressure on corporate margins and inflation expectations.

We hope you have a great week. If there’s anything we can do to help you, please feel free to reach out to ben.vaske@orion.com or opsresearch@orion.com.
 

Get Your Own Market Commentary

Client-Friendly Weekly Wire

Want a version of Weekly Wire you can send directly to your clients? Subscribe to our Weekly Wire newsletter and get a client-friendly version every Monday. Simply download, add your firm's logo, and use with your clients!


Key Data

Stocks, Bonds, Alternatives, and Real Assets as of March 13, 2026

Security Name

Risk Score

1 Wk

1 Mo

QTD

YTD

1 Yr

3 Yr Ann.

Global Equities (60% US, 40% Intl)

100

-1.80%

-4.21%

-0.82%

-0.82%

24.67%

19.72%

S&P 500 Total Return

102

-1.56%

-2.86%

-2.86%

-2.86%

21.65%

21.51%

Dow Jones Industrial Average

97

-1.91%

-5.72%

-2.75%

-2.75%

16.05%

15.67%

NASDAQ 100 Total Return

122

-1.04%

-1.34%

-3.30%

-3.30%

27.71%

27.91%

TV Benchmark

107

-1.50%

-3.30%

-2.97%

-2.97%

21.80%

21.70%

Morningstar US Large Cap

102

-1.36%

-2.32%

-4.16%

-4.16%

22.50%

23.46%

Morningstar US Mid Cap

113

-2.23%

-4.64%

0.92%

0.92%

17.52%

14.51%

Morningstar US Small Cap

125

-2.18%

-6.70%

-0.55%

-0.55%

21.42%

14.10%

Morningstar US Value

98

-1.85%

-4.52%

2.33%

2.33%

19.12%

16.73%

Morningstar US Growth

126

-1.76%

-3.64%

-4.17%

-4.17%

21.14%

20.78%

MSCI ACWI Ex USA

98

-1.99%

-5.86%

2.06%

2.06%

28.09%

17.53%

MSCI EAFE

101

-1.99%

-6.64%

0.66%

0.66%

22.42%

16.34%

MSCI EM

98

-1.96%

-5.37%

4.87%

4.87%

36.49%

18.57%

Bloomberg US Agg Bond Index

27

-0.92%

-1.42%

-0.16%

-0.16%

4.71%

3.83%

Bloomberg High Yield Corp Bond Index

41

-0.77%

-1.24%

-0.51%

-0.51%

7.18%

9.32%

Bloomberg Commodity Index

70

2.70%

15.32%

23.91%

23.91%

33.87%

13.95%

MSCI US REIT

104

-1.14%

-2.13%

7.47%

7.47%

12.81%

10.92%

US Dollar

10

0.42%

2.90%

1.44%

1.44%

-3.74%

-1.57%

Bloomberg US Treasury Bill 1-3mo

1

0.07%

0.27%

0.72%

0.72%

4.17%

4.86%

Source: Morningstar

The TV Benchmark represents an average of the S&P 500, Dow Jones IA, and NASDAQ 100 return indexes. The Orion Risk Score represents risk relative to the global equity market.


Interest Rates as of March 13, 2026

Rate

This Week

1 Wk Δ%

13-Wk Treasury Yield

3.60%

0.03%

10-Yr Treasury Yield

4.29%

0.15%

Bloomberg US Agg Yield

4.52%

0.17%

Avg Money Mkt Yield

3.47%

-0.02%

Avg 30-Yr Mortgage Rate

6.10%

0.05%

Sources: Yahoo Finance, S&P Global, Crane Data, BankRate


Key Economic Data Last Week

Data Point

Expectation

Actual

Existing Home Sales - Feb

3.86M

4.09M

Consumer Price Index (CPI) YoY - Feb

2.4%

2.4%

Core CPI YoY - Feb

2.5%

2.5%

U.S. Trade Deficit - Jan

-$67.0B

-$54.5B

Housing Starts - Feb

1.35M

1.49M

Fourth Quarter GDP (First Revision)

1.5%

0.7%

Personal Consumption Expenditures (PCE) YoY - Jan

2.9%

2.8%

Core PCE YoY - Jan

3.1%

3.1%

Job Openings - Jan

6.7M

6.9M

Source: MarketWatch


Key Economic Data This Week

Data Point

Expectation

Release Date

Producer Price Index (PPI) YoY

--

3/18/26

Core PPI YoY

--

3/18/26

Federal Reserve Interest Rate Decision

Hold

3/18/26

New Home Sales

715,000

3/19/26

Source: MarketWatch

 
More Just for You

Want Resources for Your Clients?

Get a version of Weekly Wire you can send directly to your clients. Subscribe to our Weekly Wire newsletter and get a client-friendly version every Monday. Simply download, add your firm's logo, and use with your clients!

The views expressed herein are exclusively those of Orion Portfolio Solutions, LLC d/b/a Brinker Capital Investments, a registered Investment Advisor, and are not meant as investment advice and are subject to change. Information contained herein is derived from sources we believe to be reliable, however, we do not represent that this information is complete or accurate and it should not be relied upon as such. This information is prepared for general information only. It does not have regard to the specific investment objectives, financial situation, and the particular needs of any specific person.

An index is an unmanaged group of assets considered to be representative of a select segment or segments of the market in general, as determined by the index manager for the purposes of managing a specific index. You cannot invest directly in an index.

The CFA® is a globally respected, graduate-level investment credential established in 1962 and awarded by CFA Institute — the largest global association of investment professionals. To learn more about the CFA charter, visit www.cfainstitute.org.

Think2perform’s Behavioral Financial Advice program integrates traditional finance practices with psychology and neuroscience to improve emotional competency and decision-making behavior that increases effective usage of the financial plan with clients. To obtain the Behavioral Financial Advisor (BFA) designation, participants must complete a self-directed course, which takes 20-30 hours to complete, and includes a mix of interactive exercises, videos and case studies. To learn more about the BFA, visit https://www.think2perform.com.

Wealth management services provided by Orion Portfolio Solutions, LLC (“OPS”), a registered investment advisor. Orion OCIO services provided by TownSquare Capital, LLC (“TSC”), a registered investment advisors. OPS and TSC are affiliates and wholly owned subsidiaries of Orion Advisor Solutions, Inc.