Our investment team is closely monitoring the developments in the Middle East and the impact they are having on commodity prices, the stock market, and the world economy. We lament the loss of innocent life, pray for the safety of U.S. troops in harm’s way and mourn the U.S. military servicemembers who have lost their lives. 

You will continue to hear from us on the conflict with Iran. In the meantime, if you have any questions on the markets and the economy or if there is anything we can do to support you and your clients during this difficult time, please reach out to us via our Investment Strategy Team’s email address at opsresearch@orion.com

Weekly Notes from Tim

By Tim Holland, CFA, Chief Investment Officer

  • When it comes to market reviews, typical look back periods are three months, or six months or a full year. At the risk of going rogue, we thought, as June kicks off, we would look back on the first five months of 2026, with a focus on what has hindered and helped risk assets during this rather remarkable year.
     
  • The war in the Middle East has been the biggest macro event and headwind of 2026, and the biggest macro event since the COVID-19 pandemic, driving commodity prices, particularly oil, higher along with inflation and inflation expectations and driving consumer sentiment lower. We have also contended with the war of words between the White House and the then Jay Powell led Federal Reserve, uncertainty around trade policy, signs of distress in private credit and concerns AI was a capital spending and stock market bubble and an imminent disruptor of millions of white-collar jobs. Despite those headwinds, equity indices are up nicely in 2026, with the S&P 500 returning 11%, the Nasdaq 16.2%, the Russell 2000 18%, the MSCI EAFE Index 9.1% and the MSCI EM Index 25.4%.
     
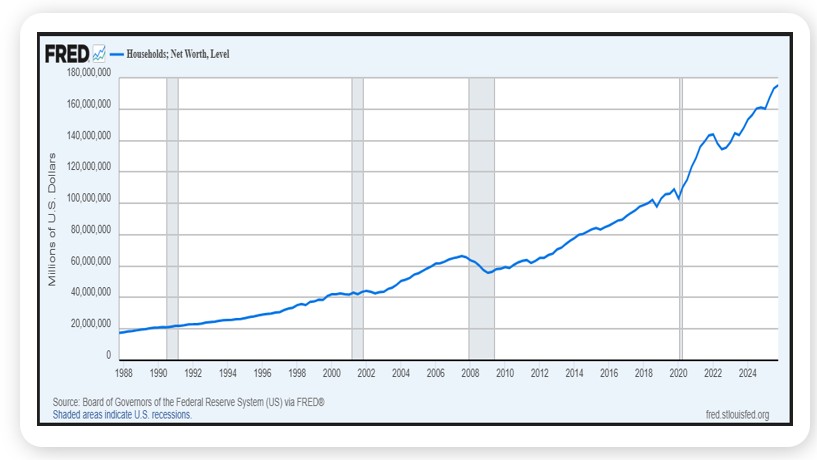
  • Any list of the positives that have overcome the negatives this year should begin with earnings – 2026 EPS growth for the S&P 500, MSCI EAFE and MSCI EM should range between 17% and 24%. What is driving that growth first and foremost is the AI build out – Amazon, Google, Meta and Microsoft are expected to spend $725 billion+ on cap ex this year – and its worth noting the largest positions in the MSCI EAFE and EM Indices are tech names (and for the EM Index five of the ten largest stocks are tech names accounting for 26% of the index). Beyond but tied to earnings, has been the resiliency of the US consumer, buoyed by a resurgent jobs market and record household net worth, a result of historically high housing and equity prices (see chart), while increasing US productivity – a trend which AI may be accelerating – is aiding record profit margins. Finally, fiscal policy here at home and in key countries including Germany is supportive of economic growth.
     
  • Though equities have rallied in 2026, inflation has pressured bond prices with the Bloomberg Aggregate Index off 0.8% this year. That written, a 60/40 MSCI All Country World Index and Agg portfolio is up 7% in 2026, a nice gain for five months in the market. We can only guess at what the next seven months will bring.


    Picture1

Source, FactSet, May 2026


Looking Back, Looking Ahead

By Ben Vaske, BFA, Manager, Investment Strategy

Last Week

U.S. equity markets closed at new all-time highs for another consecutive week, with the S&P 500 gaining 1.6% and the NASDAQ 100 advancing 2.9% as falling oil prices provided a tailwind. WTI crude pulled back roughly 9% on the week to $88 per barrel amid developing ceasefire talks in the Middle East, though it remains about 48% above where it stood when the conflict began. Two-thirds of the way through the second quarter, the NASDAQ 100 is up approximately 28% for the period, narrowly ahead of emerging markets at 26%. The broad commodity index retreated with oil but remains up roughly 25% year-to-date.

On the economic front, Q1 GDP was revised lower to 1.6% annualized growth, down from the initial reading of 2.0%, marking the second consecutive quarter of below-long-term-average expansion. The revision was driven primarily by weaker consumer spending on services and softer business investment. Separately, the PCE inflation reading came in as expected but at 3.8% year-over-year, its highest level in roughly three years, and now represents 62 straight months above the Fed's 2% target. The personal savings rate fell to just 2.6% as spending continues to outpace income growth, a dynamic that is unlikely to be sustainable and points to potential headwinds for consumer spending ahead.


This Week

Welcome to June. The first week of the month brings the full suite of labor market data, including ADP Employment on Wednesday, followed by nonfarm payrolls and the unemployment rate on Friday. The unemployment rate is expected to hold steady at 4.3%. On the earnings calendar, Broadcom and CrowdStrike are the marquee names reporting after the close Wednesday. The Fed meeting on June 17th remains essentially a foregone conclusion, with markets pricing a 99.6% probability of no change in rates, making this week's employment data more relevant for the longer-term policy outlook under new Fed Chair Kevin Warsh.

We hope you have a great week. If there’s anything we can do to help you, please feel free to reach out to ben.vaske@orion.com or opsresearch@orion.com.
 

Get Your Own Market Commentary

Client-Friendly Weekly Wire

Want a version of Weekly Wire you can send directly to your clients? Subscribe to our Weekly Wire newsletter and get a client-friendly version every Monday. Simply download, add your firm's logo, and use with your clients!


Key Data

Stocks, Bonds, Alternatives, and Real Assets as of May 29, 2026

Security Name

Risk Score

1 Wk

1 Mo

QTD

YTD

1 Yr

3 Yr Ann.

Global Equities (60% US, 40% Intl)

100

1.72%

6.01%

15.69%

12.61%

30.89%

22.24%

S&P 500 Total Return

102

1.60%

6.07%

16.05%

11.02%

30.02%

23.28%

Dow Jones Industrial Average

97

0.91%

2.94%

10.38%

6.86%

22.71%

17.84%

NASDAQ 100 Total Return

122

2.89%

10.58%

27.90%

20.45%

43.09%

29.60%

TV Benchmark

107

1.80%

6.53%

18.11%

12.78%

31.94%

23.57%

Morningstar US Large Cap

102

1.63%

6.05%

18.02%

10.84%

31.37%

25.25%

Morningstar US Mid Cap

113

1.34%

3.23%

11.92%

13.28%

22.88%

18.60%

Morningstar US Small Cap

125

1.08%

1.88%

9.75%

9.75%

27.62%

17.45%

Morningstar US Value

98

-0.68%

0.47%

3.52%

6.67%

22.31%

17.67%

Morningstar US Growth

126

3.03%

8.26%

21.26%

13.75%

28.01%

22.94%

MSCI ACWI Ex USA

98

2.03%

5.11%

15.33%

14.65%

33.43%

21.43%

MSCI EAFE

101

1.08%

3.18%

10.98%

9.74%

23.37%

18.74%

MSCI EM

98

3.96%

9.71%

25.87%

25.74%

55.15%

25.77%

Bloomberg US Agg Bond Index

27

0.83%

0.31%

0.42%

0.38%

5.13%

3.95%

Bloomberg High Yield Corp Bond Index

41

0.55%

0.49%

2.19%

1.68%

7.57%

9.36%

Bloomberg Commodity Index

70

-2.49%

-3.56%

0.49%

25.03%

40.47%

16.59%

Wilshire Liquid Alternatives 

25

0.36%

0.85%

2.92%

2.95%

9.58%

6.70%

MSCI US REIT

104

-1.27%

-0.20%

8.80%

14.07%

16.82%

13.10%

US Dollar

10

-0.24%

0.39%

-0.94%

0.71%

-0.86%

-1.69%

Bloomberg US Treasury Bill 1-3mo

1

0.06%

0.31%

0.61%

1.50%

4.01%

4.78%

Source: Morningstar

The TV Benchmark represents an average of the S&P 500, Dow Jones IA, and NASDAQ 100 return indexes. The Orion Risk Score represents risk relative to the global equity market.


Interest Rates as of May 29, 2026

Rate

This Week

1 Wk Δ%

13-Wk Treasury Yield

3.59%

0.00%

10-Yr Treasury Yield

4.45%

-0.11%

Bloomberg US Agg Yield

4.64%

-0.11%

Avg Money Mkt Yield

3.43%

0.01%

Avg 30-Yr Mortgage Rate

6.56%

-0.09%

Sources: Yahoo Finance, S&P Global, Crane Data, BankRate


Key Economic Data Last Week

Data Point

Expectation

Actual

Consumer Confidence 

92.0

93.1

Durable Goods Orders

3.5%

7.9%

New Home Sales

663,000

622,000

1Q GDP (Second Revision)

2.0%

1.6%

Personal Consumption Expenditures (PCE) YoY

3.8%

3.8%

Core PCE YoY

3.3%

3.3%

Source: MarketWatch


Key Economic Data This Week

Data Point

Expectation

Release Date

US Manufacturing PMI

-- 

6/01/2026

ADP Employment

120,000

6/03/2026

US Services PMI

--

6/03/2026

US Employment Report

90,000

6/05/2026

Unemployment Rate

4.3%

6/05/2026

Source: MarketWatch

 
More Just for You

Want Resources for Your Clients?

Get a version of Weekly Wire you can send directly to your clients. Subscribe to our Weekly Wire newsletter and get a client-friendly version every Monday. Simply download, add your firm's logo, and use with your clients!

The views expressed herein are exclusively those of Orion Portfolio Solutions, LLC d/b/a Brinker Capital Investments, a registered Investment Advisor, and are not meant as investment advice and are subject to change. Information contained herein is derived from sources we believe to be reliable, however, we do not represent that this information is complete or accurate and it should not be relied upon as such. This information is prepared for general information only. It does not have regard to the specific investment objectives, financial situation, and the particular needs of any specific person.

An index is an unmanaged group of assets considered to be representative of a select segment or segments of the market in general, as determined by the index manager for the purposes of managing a specific index. You cannot invest directly in an index.

The CFA® is a globally respected, graduate-level investment credential established in 1962 and awarded by CFA Institute — the largest global association of investment professionals. To learn more about the CFA charter, visit www.cfainstitute.org.

Think2perform’s Behavioral Financial Advice program integrates traditional finance practices with psychology and neuroscience to improve emotional competency and decision-making behavior that increases effective usage of the financial plan with clients. To obtain the Behavioral Financial Advisor (BFA) designation, participants must complete a self-directed course, which takes 20-30 hours to complete, and includes a mix of interactive exercises, videos and case studies. To learn more about the BFA, visit https://www.think2perform.com.

Wealth management services provided by Orion Portfolio Solutions, LLC (“OPS”), a registered investment advisor. Orion OCIO services provided by TownSquare Capital, LLC (“TSC”), a registered investment advisors. OPS and TSC are affiliates and wholly owned subsidiaries of Orion Advisor Solutions, Inc.