


Our investment team is closely monitoring the developments in the Middle East and the impact they are having on commodity prices, the stock market, and the world economy. We lament the loss of innocent life, pray for the safety of U.S. troops in harm’s way and mourn the U.S. military servicemembers who have lost their lives.
You will continue to hear from us on the conflict with Iran. In the meantime, if you have any questions on the markets and the economy or if there is anything we can do to support you and your clients during this difficult time, please reach out to us via our Investment Strategy Team’s email address at opsresearch@orion.com.
Weekly Notes from Tim
By Tim Holland, CFA, Chief Investment Officer
- The Orion Investment Team doesn’t normally opine on individual stocks, instead we focus on macro, market, and policy analysis; credit selection; investment strategy and manager due diligence, and asset allocation and portfolio construction. Yet these are not normal times, not with the coming initial public offering of Elon Musk’s SpaceX – expected to be the largest IPO ever – and so we’ve decided to take pen to paper on the SpaceX IPO and what it might mean for the markets.
- Anyone with access to AI can get a pretty good look at SpaceX’s financials and the structure of its IPO. SpaceX has three primary businesses (Starlink, Launch Services and xAI), and generated $19 billion in revenue and a loss of $4.9 billion in 2025. At its IPO, SpaceX is expected to sell 555 million shares of stock at $135 a share, raising $75 billion and giving it a market cap of $1.75 trillion. The offering is expected to be split between institutional and retail investors 70 / 30 and Mr. Musk will retain control of the company due to his ownership of super voting shares. There are a few things, beyond its size, that make the SpaceX IPO unique – first the percentage of the company being offered for sale – about 4% - is low and the percentage of the equity allocated to retail investors – about 30% - is high while some index providers are tweaking index construction rules in ways that would enable SpaceX to join their indices much sooner than has historically been the case (and likely end up in index funds much sooner than historically has been the case).
The two questions we’ve gotten most on the IPO are 1) Should I buy the stock (no comment, though the research we have seen has shown the average IPO underperforms its index for the three years post listing, and one could argue the easy money for SpaceX investors was made in private markets) and 2) Could a disappointing IPO spark a market correction (given the nominal amount of equity being offered and a likely nominal presence in indices and index funds we don’t see the IPO creating structural risk for the market; and keep in mind US stock market capitalization is $76 trillion). We do think the IPO is another sign of a resurgent IPO market (see chart). For a deeper dive into the SpaceX IPO, we highly recommend this recent Orion Investment Team video and blog post here.
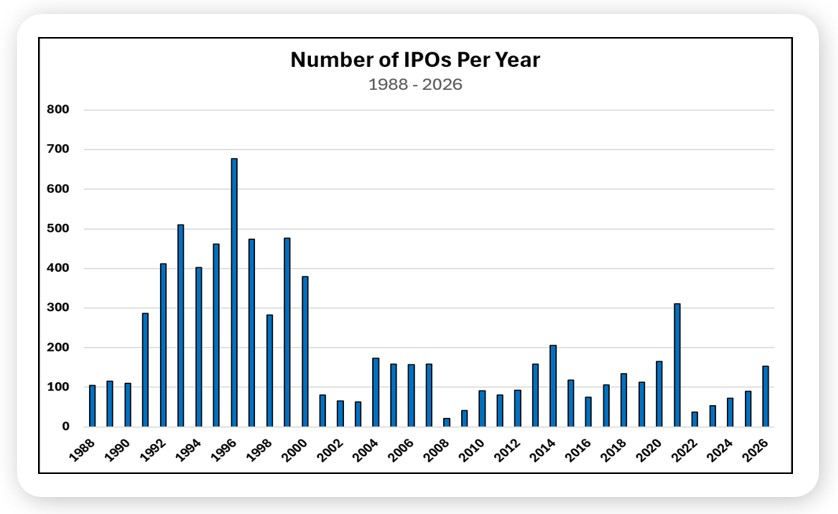
Source Jay Ritter, University of Florida
Looking Back, Looking Ahead
By Ben Vaske, CFA, Manager, Investment Strategy
Last Week
After several weeks of broad gains, equity markets hit a speed bump last week as tech sold off in the back half of the week. The NASDAQ 100 fell 4.5% on Friday, its worst single-day performance since the Liberation Day selloff, following a disappointing semiconductor sales outlook from Broadcom that rattled confidence across the AI supply chain. The selling was not contained to U.S. markets, with international equities also declining, particularly in tech-heavy emerging markets. Despite the pullback, the NASDAQ 100 remains the top-performing U.S. index year-to-date. Rates rose on the week, with the 10-year Treasury yield surging back above 4.5%, pushing fixed income lower and leaving the Bloomberg Agg negative for the year.
The May employment report was a bright spot on the surface, with 172,000 nonfarm payrolls added against a consensus expectation of 88,000, and prior months revised higher by a combined 93,000. The unemployment rate held steady at 4.3%. However, beneath the headline, job creation remains concentrated, with healthcare, social assistance, and leisure and hospitality accounting for the bulk of recent gains, a pattern that points to narrowing rather than broad-based labor market momentum. Separately, S&P Dow Jones confirmed it will not adjust index inclusion rules to accommodate early entry for SpaceX, Anthropic, or OpenAI, a notable development for passive investors ahead of what are expected to be historically large IPOs.
This Week
Inflation moves back to center stage this week, with CPI due out and currently expected to come in at 4.2% year-over-year, which would be the highest reading since April 2023. PPI follows later in the week. With the FOMC meeting on June 17th now just around the corner and markets pricing only a 5% probability of a rate cut, the inflation data will be closely watched for what it signals about the pace of policy under Kevin Warsh. On the earnings calendar, Oracle and Adobe are the headliners in an otherwise light week, while Q2 earnings season is just getting underway with current estimates pointing to 21.7% year-over-year growth for the quarter.
We hope you have a great week. If there’s anything we can do to help you, please feel free to reach out to ben.vaske@orion.com or opsresearch@orion.com.