


Key Takeaways
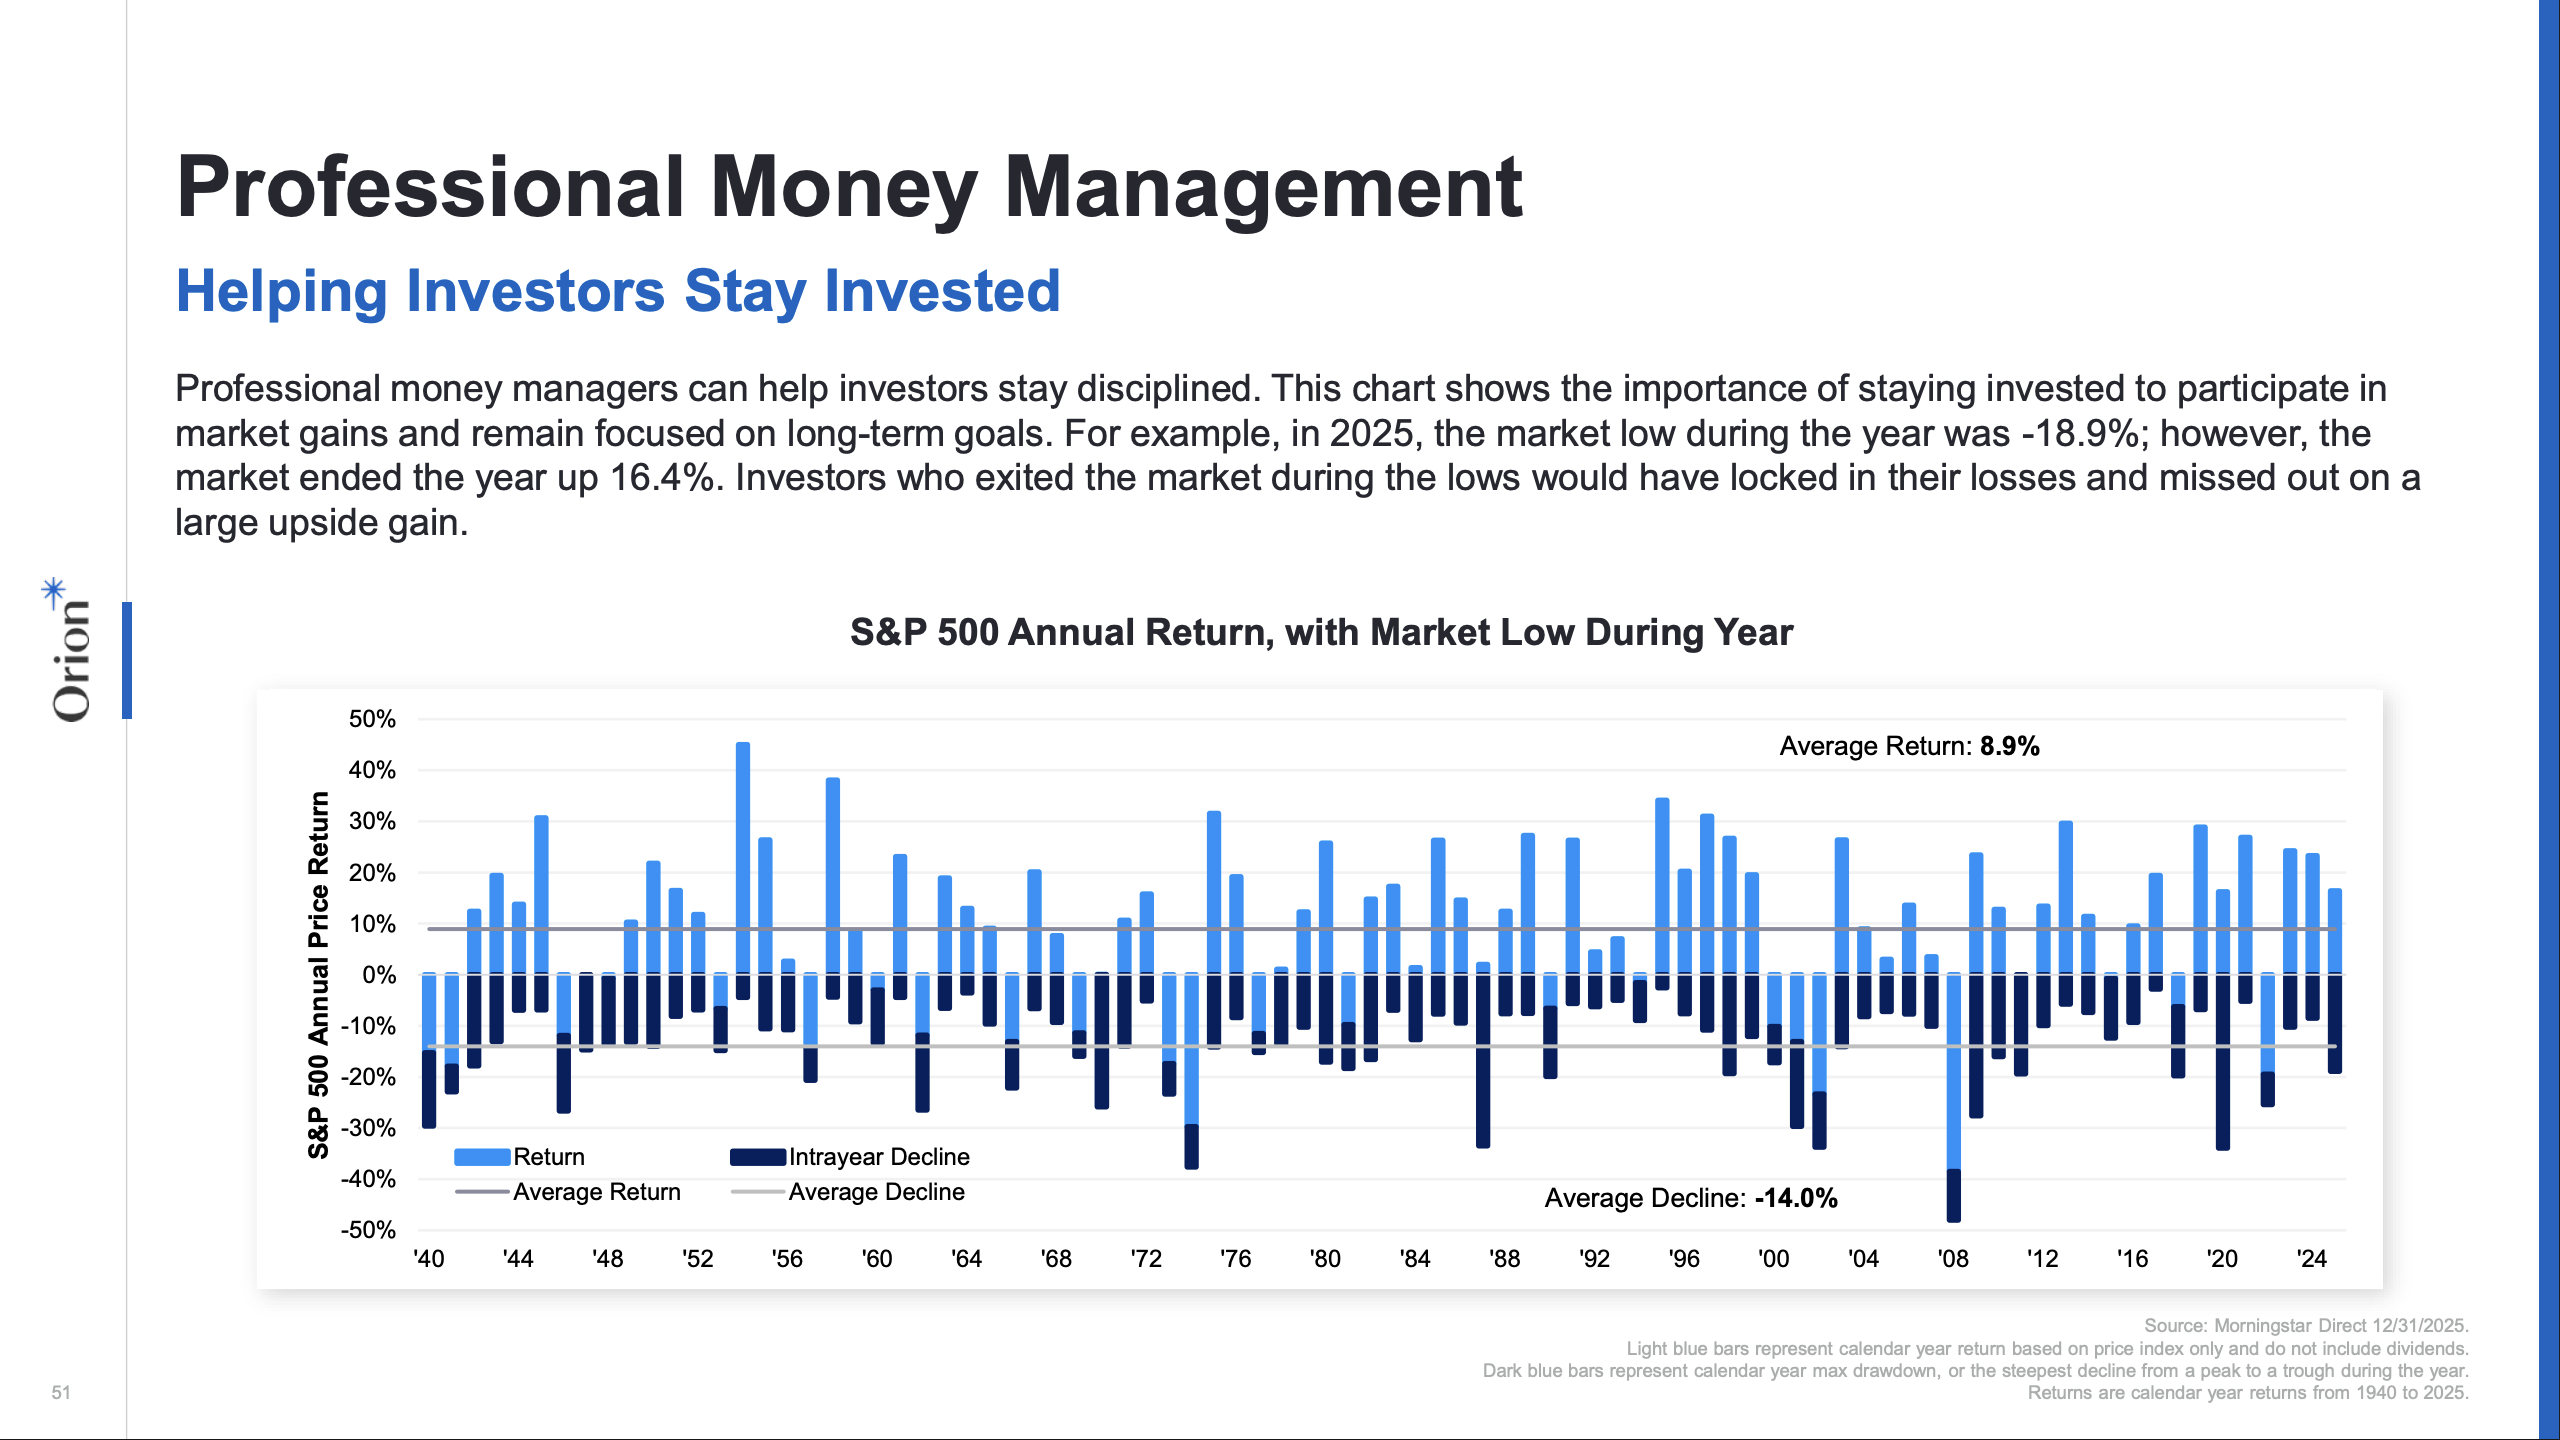
- Risk is the price investors pay for returns, and drawdowns should be expected throughout the market cycle. The average intra-year drawdown since 1940 is -14%, while annualized total return in that time is 9%.
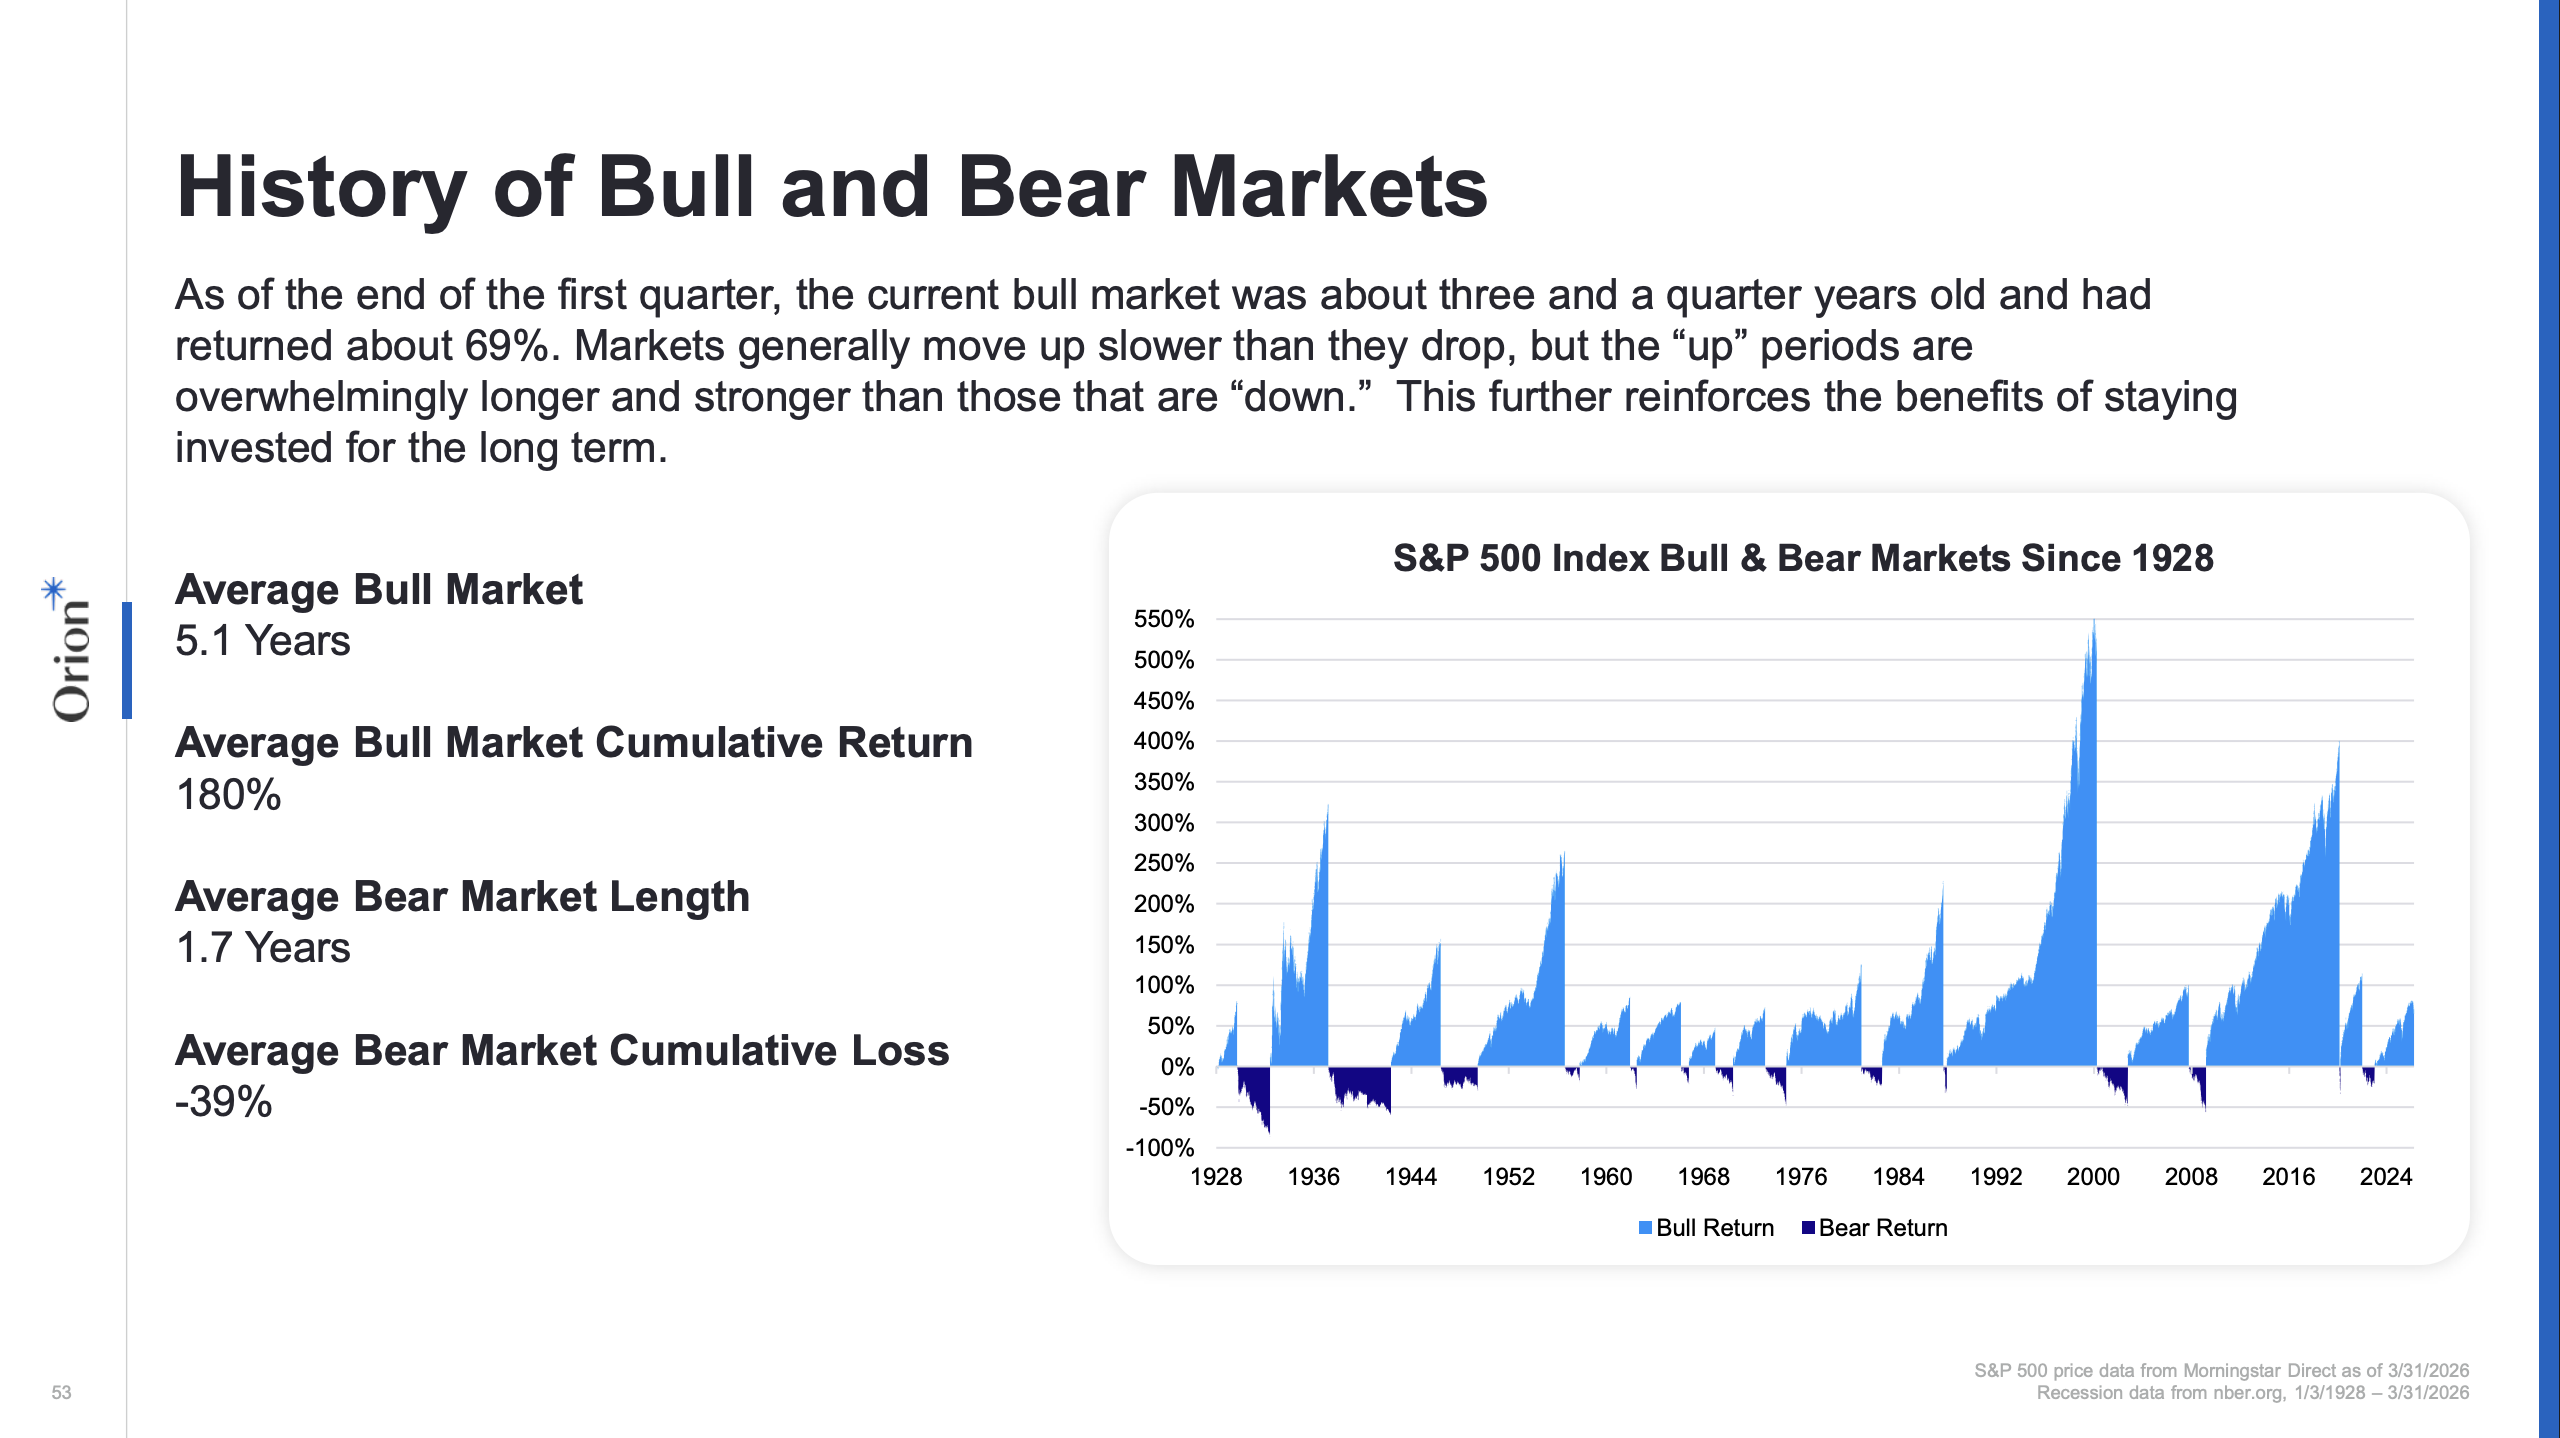
- Markets move up slower than they move down, but the “up” periods are historically longer and stronger than the “down.”
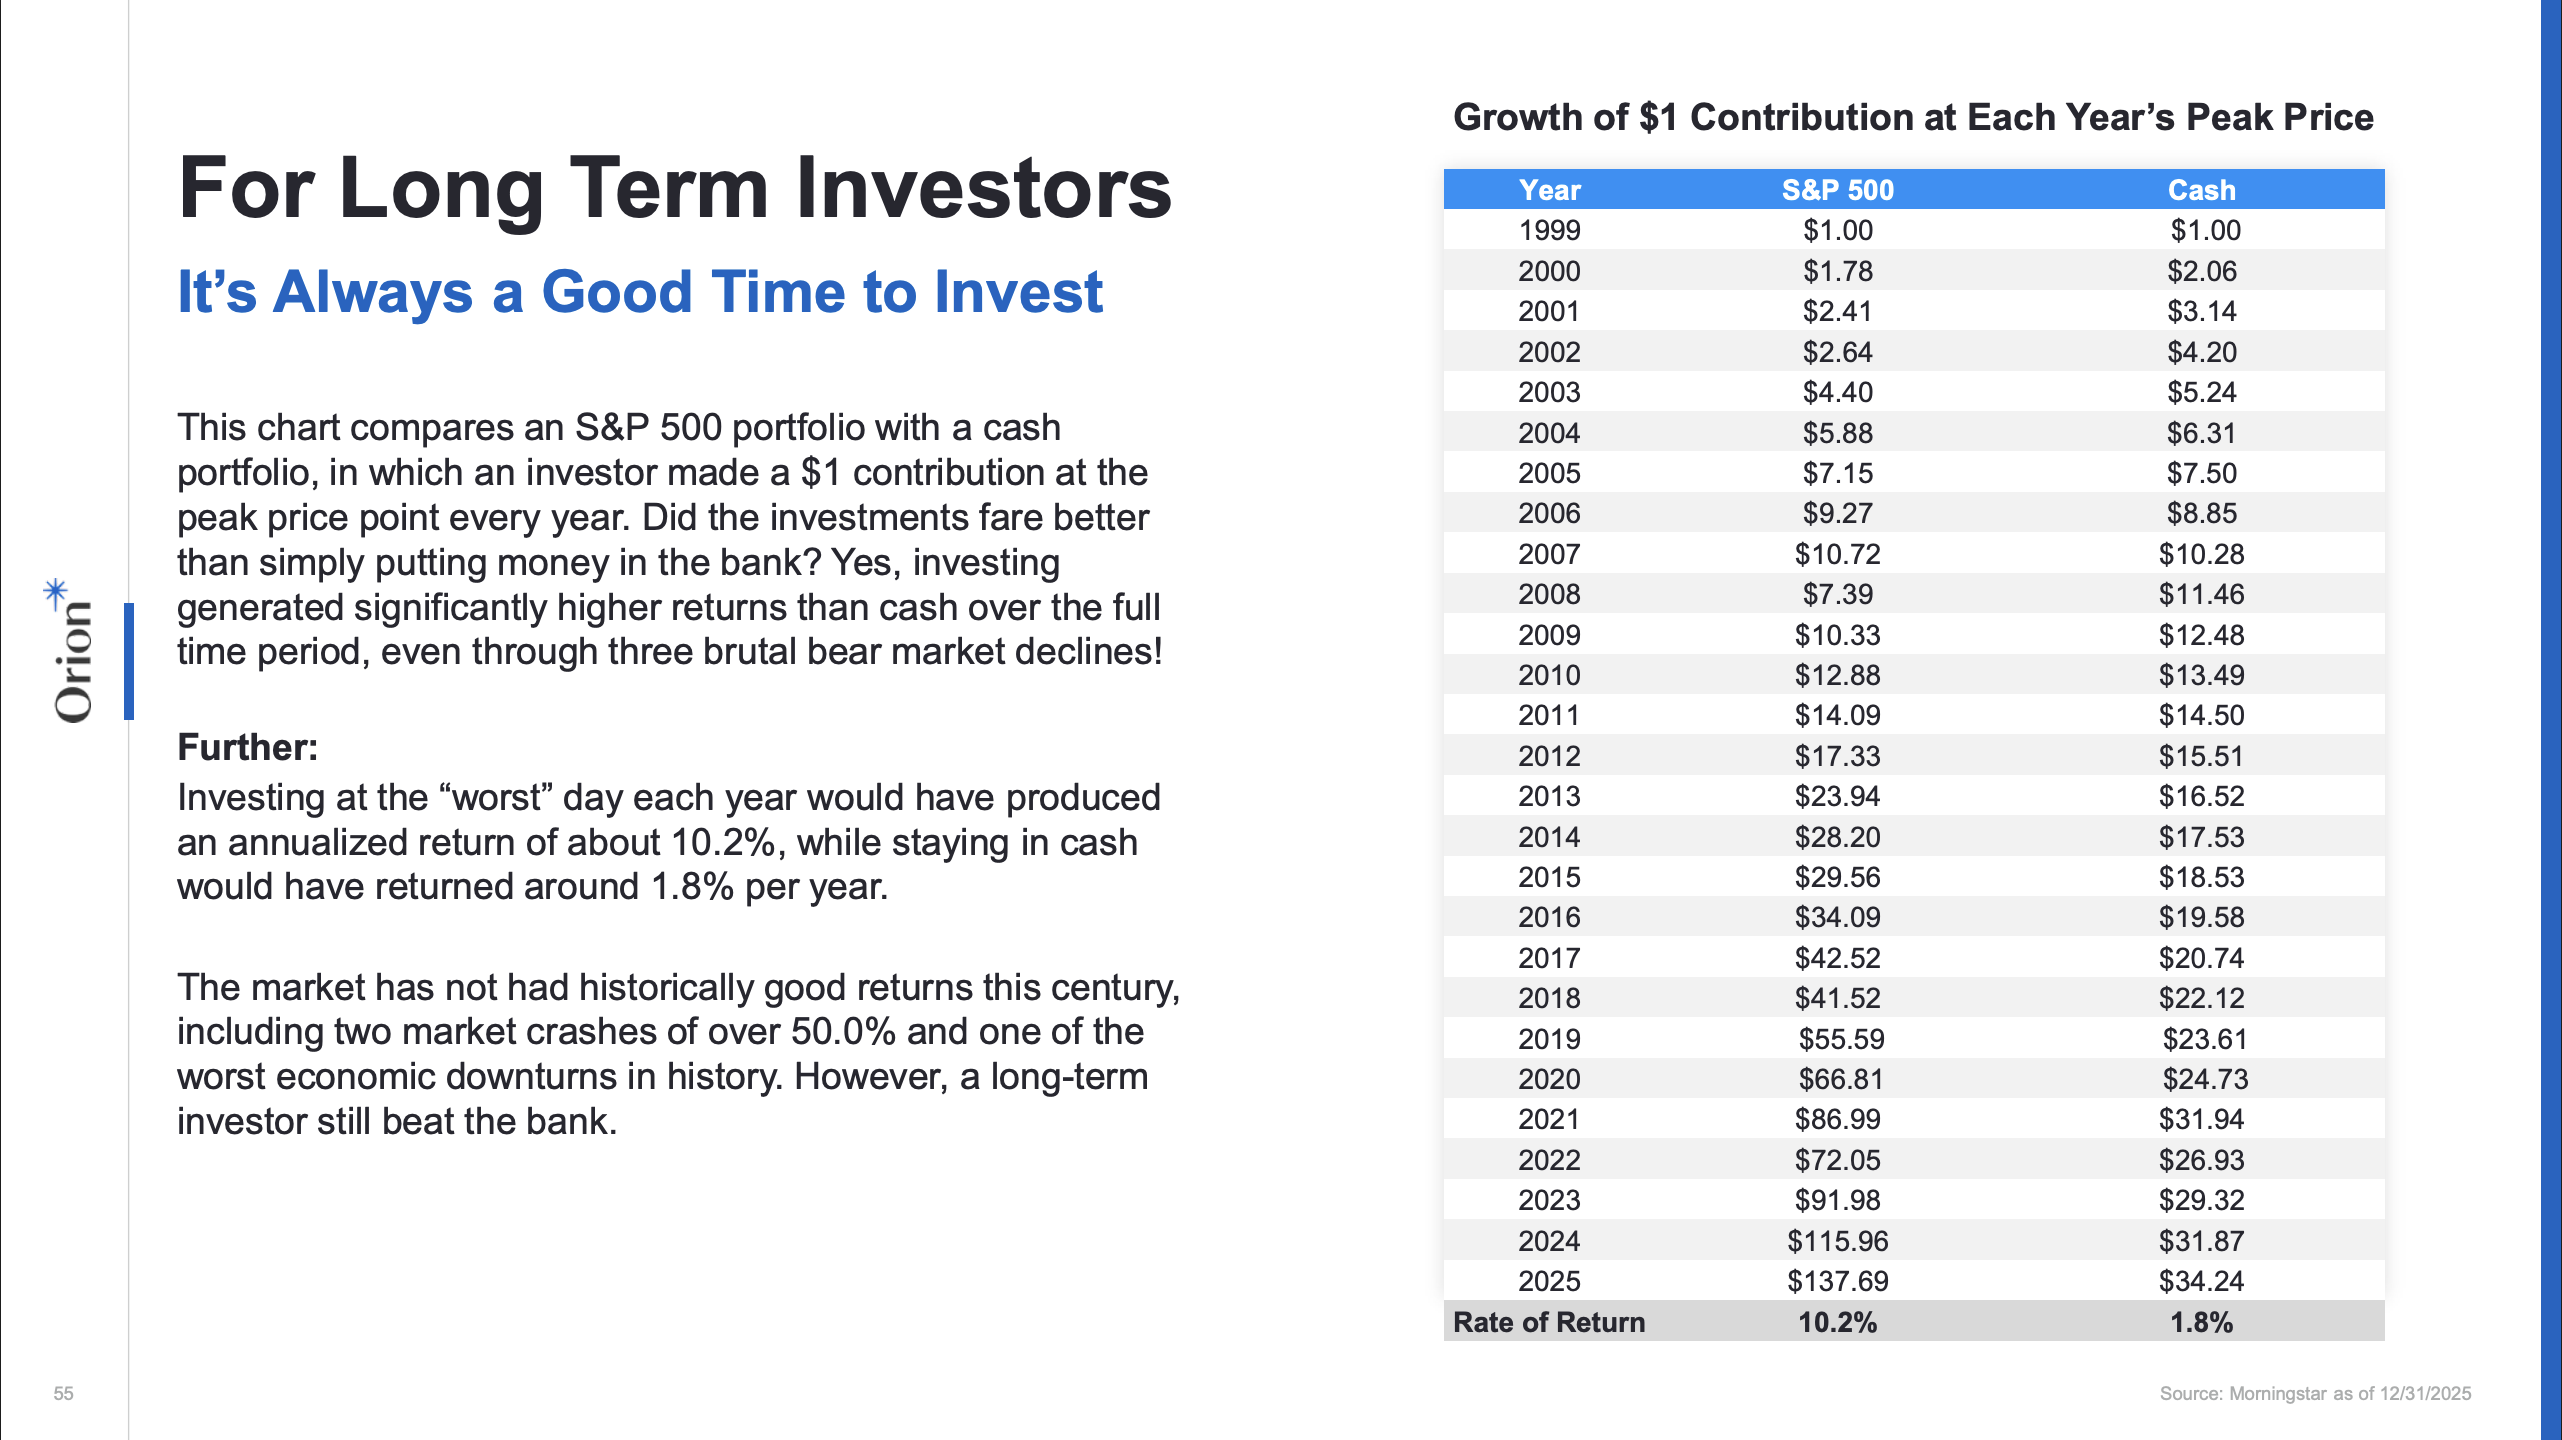
- Markets at all-time highs are not a reason to stay in cash – even buying at market tops benefits investors in the long-run.
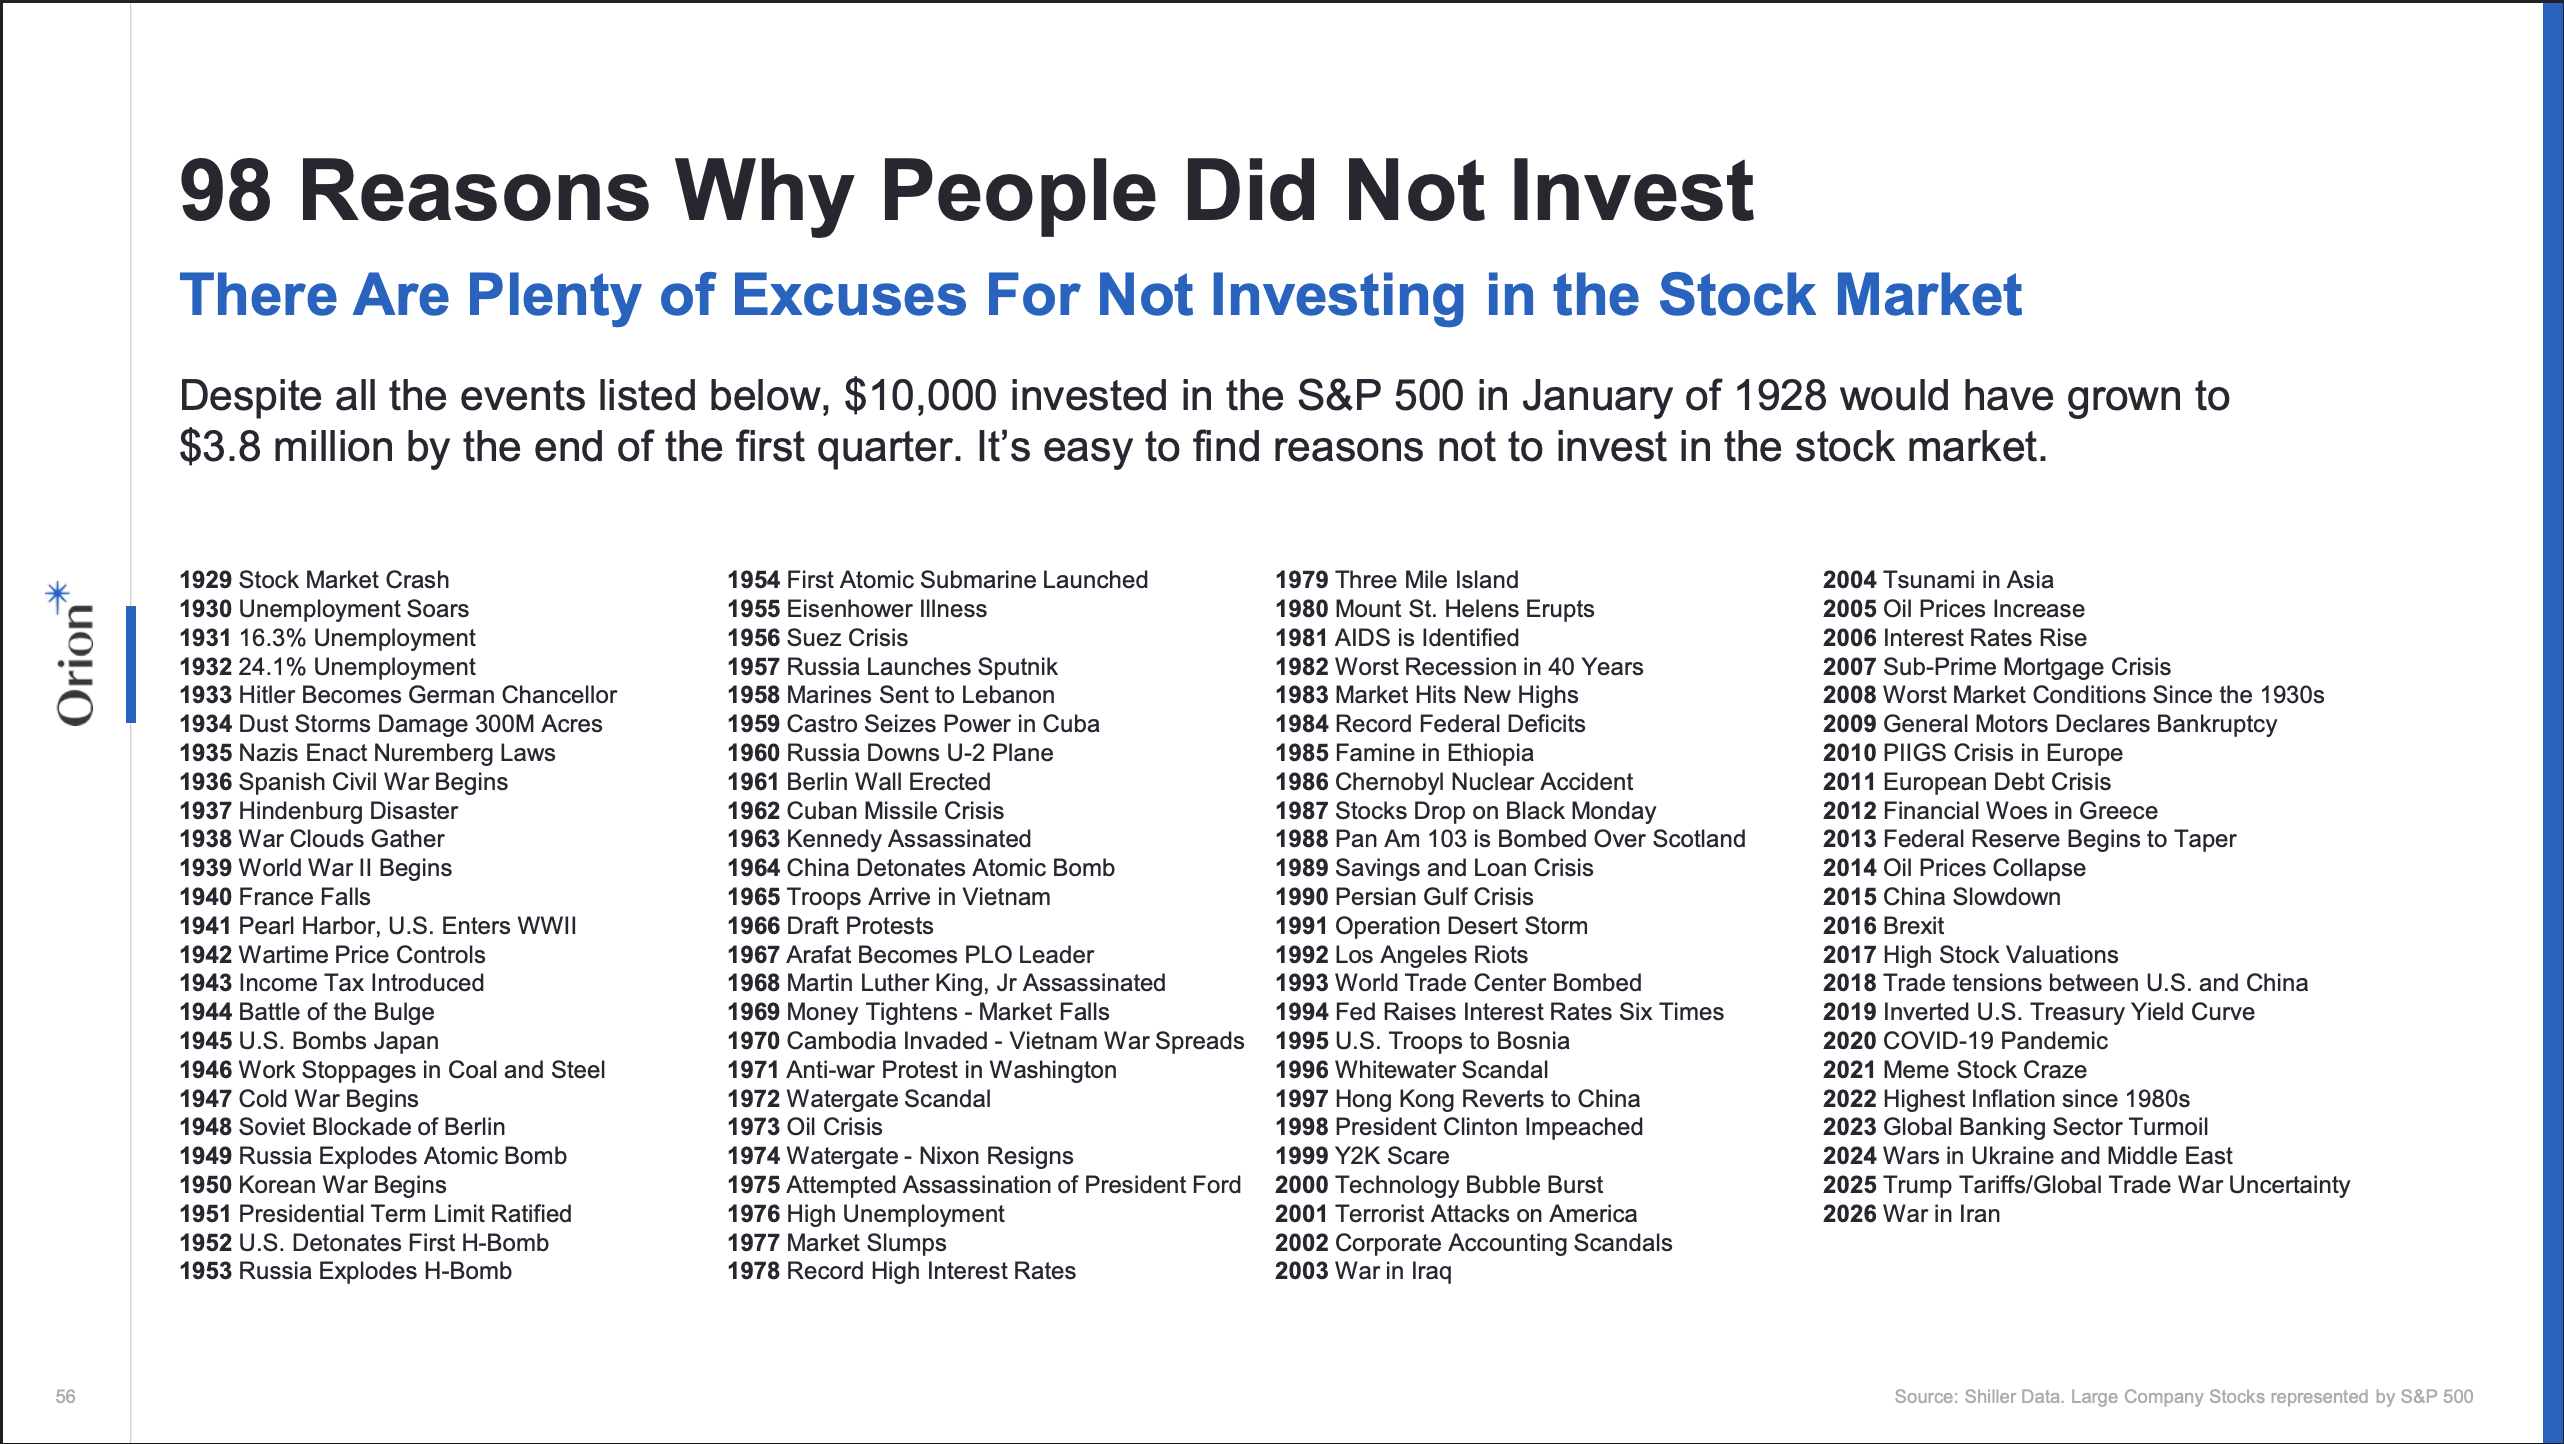
- Between economics, geopolitics, and financial market conditions, there will always be reasons investors can find to not invest in the stock market. Disciplined investors who can look through the noise may be rewarded over the long term.
Perhaps the most important role of a financial advisor is coaching clients through bull and bear markets, helping them to stay disciplined and stick to their long-term plan. Several studies suggest behavioral coaching is, by far, how advisors can add the most value for their clients. This is why the focus of the Orion Quarterly Reference Guide is to arm advisors with charts and data to back up critical investing advice. The Bull and Bear Markets section of the Guide helps to counter common objections from new investors, three of which we will analyze in the rest of this article.
Client Concern: “I want market participation, but I don’t want to lose any money.”
Investors expecting returns above the risk-free rate must accept some level of risk, and those who desire the historically superior returns of equities must accept certain amounts of risk. In his book, Stocks for the Long Run, renowned economist Jeremy Siegel argues that, using history as a guide, stocks have been the best way to protect purchasing power and earn returns above inflation over the long-term for those who have the right temperament (an important caveat). He also concedes that, “in the short run, however, stock returns are very volatile, driven by changes in earnings, interest rates, risk, and uncertainty, as well as psychological factors, such as optimism and pessimism as well as fear and greed.”
Put simply – risk is the price of admission for owning equities, and drawdowns should be expected on a regular basis. Slide 51 of the Reference Guide shows the S&P 500’s annual returns in royal blue, and each year’s maximum drawdown in navy. The average annual max drawdown in the S&P 500 since 1940 is -14%, and the annualized return is nearly 9%. Investors who exit the market at its low points lock in those losses, while disciplined, long-term investors gain the opportunity to ride the recovery.
Below is another helpful chart to deliver perspective to clients concerned about investing through bear markets. Bear markets move fast, but their duration and magnitude pale in comparison to structural bull markets. Investing is not a zero-sum game – nasty selloffs have ravaged markets in the past, but the subsequent recoveries and expansions have turned that pain from reality into memory for disciplined investors who stayed the course.
Client Concern: “Markets are at all-time highs. Let’s wait for a correction before we invest.”
- Even the unluckiest investors can find success in the long term. The S&P 500 portfolio in the chart below assumes an investor made a $1 contribution at each calendar year’s peak price – as unlucky as you can be in a dollar-cost averaging portfolio. Despite this, this disciplined investor fared far better than one who waited in cash instead of investing at market peaks.
- In a momentum-driven market, a fresh all-time high may be followed by several more in short order. The current bull market has featured 120 new all-time highs in just under four years. That’s what structural bull markets do – they stretch prices to new highs and set new floors that may or may not ever be breached again, so sitting on the sidelines waiting for that reversal can get very expensive in opportunity cost.
Client Concern: “I’m worried about what I see in the news. Let’s wait for things to calm down a bit.”
Two things are true about this day and age:
- There is a lot of volatility, uncertainty, and negativity in the news and on social media today, and major geopolitical events may be starting to feel like a common occurrence.
- Access to this news and information has never been easier, and the people providing it are financially incentivized to show you the scariest and most upsetting stories of the day, as these stories generate more engagement than positive ones.
Geopolitical events can greatly affect people’s lives – we don’t discount that. However, there have been reasons to be concerned every year for the past century, and none of those reasons have stopped the stock market from generating massive amounts of wealth for disciplined investors. Things may never “calm down” to the level we’d all hope for, and our investment plans should account for that.
Helping a client get mentally on board for the ups and downs of stock market investing is potentially the highest-value conversation an advisor can have with a client. Hopefully, these charts and some of the many others in the Orion Reference Guide can give you extra support and talking points for those conversations. If you’d like to discuss anything in the Guide in more detail or have a client objection that the Guide does not address, please feel free to reach out to us at opsresearch@orion.com.