


Our investment team is closely monitoring the developments in the Middle East and the impact they are having on commodity prices, the stock market, and the world economy. We lament the loss of innocent life, pray for the safety of U.S. troops in harm’s way and mourn the U.S. military servicemembers who have lost their lives.
You will continue to hear from us on the conflict with Iran. In the meantime, if you have any questions on the markets and the economy or if there is anything we can do to support you and your clients during this difficult time, please reach out to us via our Investment Strategy Team’s email address at opsresearch@orion.com.
Weekly Notes from Tim
By Tim Holland, CFA, Chief Investment Officer
- Several story lines commanded Wall Street’s attention in 2025, including Liberation Day, the war of words between the White House and the then Jay Powell led Federal Reserve, the exceptional performance of international equities and the approximate 9% drop in the US dollar, the Greenback’s most precipitous annual decline since 2017 (it’s start to the year was even rougher; the dollar fell 11% through the first six months of 2025, its steepest first half drop since 1973). As to why the world’s reserve currency fell as much as it did last year, investors could point towards a few potential catalysts, including US policy uncertainty (think trade and national security) driving overseas investors to pare dollar exposure; pronounced and persistent US government deficits, and expected Fed rate cuts in 2026. Some investors saw the 2025 drop as part of a secular dollar bear market they believe kicked off with the dollar’s two-decade, late 2022 peak.
- And while it is very possible the dollar is some part of the way through a multi-year bear market, it has been very much on the front foot in 2026. Consider that since hitting a four year low on January 27th, the ICE US Dollar Index – which measures the dollar against a basket of other currencies – rallied 7% to 101.8 on June 24th, a 13-month high (see chart). As to why the dollar has strengthened of late, we would call out a hawkish pivot by the US Federal Reserve and its new Chair, Kevin Warsh (investors are pricing in a quarter point rate hike at the Fed’s September meeting); an accelerating jobs market and US economy (the Atlanta Fed’s GDPNow estimate puts Q2 economic growth at 2.5%) and a reminding for the world of America’s military capabilities vis a vis the war with Iran.
- As for what this means for the markets and economy, a stronger US dollar should attract foreign capital to US financial assets, tamp down inflation, make overseas earnings for US multi-nationals worth less – as those earnings are repatriated into US dollars – and bias our trade deficit higher (as imported goods become cheaper for American consumers). All things considered, when we weigh the pros of cons of a strong and a weak dollar, we prefer the former over the latter as we think it reflects an overall optimism about the current and future state of America. And speaking of America, Happy 4th of July!
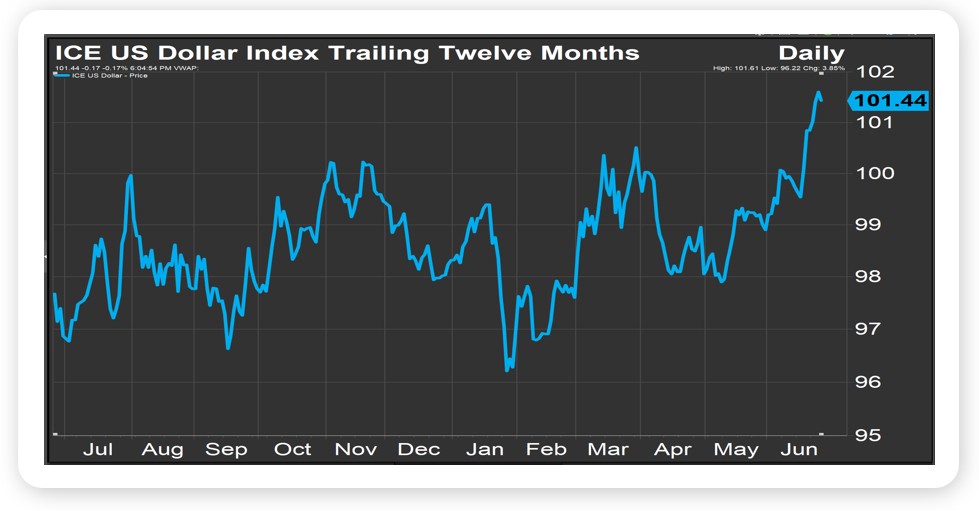
Source, FactSet June 2026
Looking Back, Looking Ahead
By Ben Vaske, CFA, Manager, Investment Strategy
Last Week
It was a difficult week for large cap growth and technology stocks, with the S&P 500 falling roughly 2% and the NASDAQ 100 retreating more than 4%. June has been a choppy month overall, with the S&P 500 failing to reach a new high since the first week of the month following a strong start to the second quarter. Value stocks and small caps have been a relative bright spot, outperforming the S&P 500 year-to-date. Commodities also sold off, with the Bloomberg Commodity Index falling roughly 3% as crude oil plunged nearly 9% on the week to below $70 per barrel, continuing a meaningful reversal from the conflict-driven highs seen earlier in the year as traffic through the Strait of Hormuz continues to work toward normality.
On the inflation front, PCE rose 4.1% year-over-year in May, with core PCE at 3.4%, reflecting the lingering impact of energy price shocks from the Middle East conflict. The Fed is expected to remain on pause as energy prices recede and policymakers wait for a clearer read on sustained inflation pressures. Micron posted strong earnings, capping an exceptional quarter for AI-related earnings growth, though Apple announced meaningful price increases across much of its product line as higher chip and memory costs begin reaching consumers. SpaceX shares pulled back roughly 13% last week, with NASDAQ subsequently announcing the stock will join the NASDAQ 100 on July 7th, creating a structural bid from passive funds.
This Week
Employment data takes center stage in a shortened holiday week, with consensus expectations calling for 118,000 jobs added in June and the unemployment rate holding steady at 4.3%. A strong labor market has been one of the economy's more reliable anchors as inflation has remained elevated, and another solid report is widely anticipated. Markets are closed Friday in observance of Independence Day. On the earnings calendar, Nike headlines an otherwise quiet week, with Q2 earnings season still in its early stages and current estimates tracking at 23.1% year-over-year growth for the quarter.
We hope you have a great week. If there’s anything we can do to help you, please feel free to reach out to ben.vaske@orion.com or opsresearch@orion.com.